AI's Canvas: Data VIZ AND CODE — TIGHT TIMELINES and Model Boundaries
01. Overview
This case study highlights how I balanced model constraints with practical UX design solutions at the onset of the AI race.
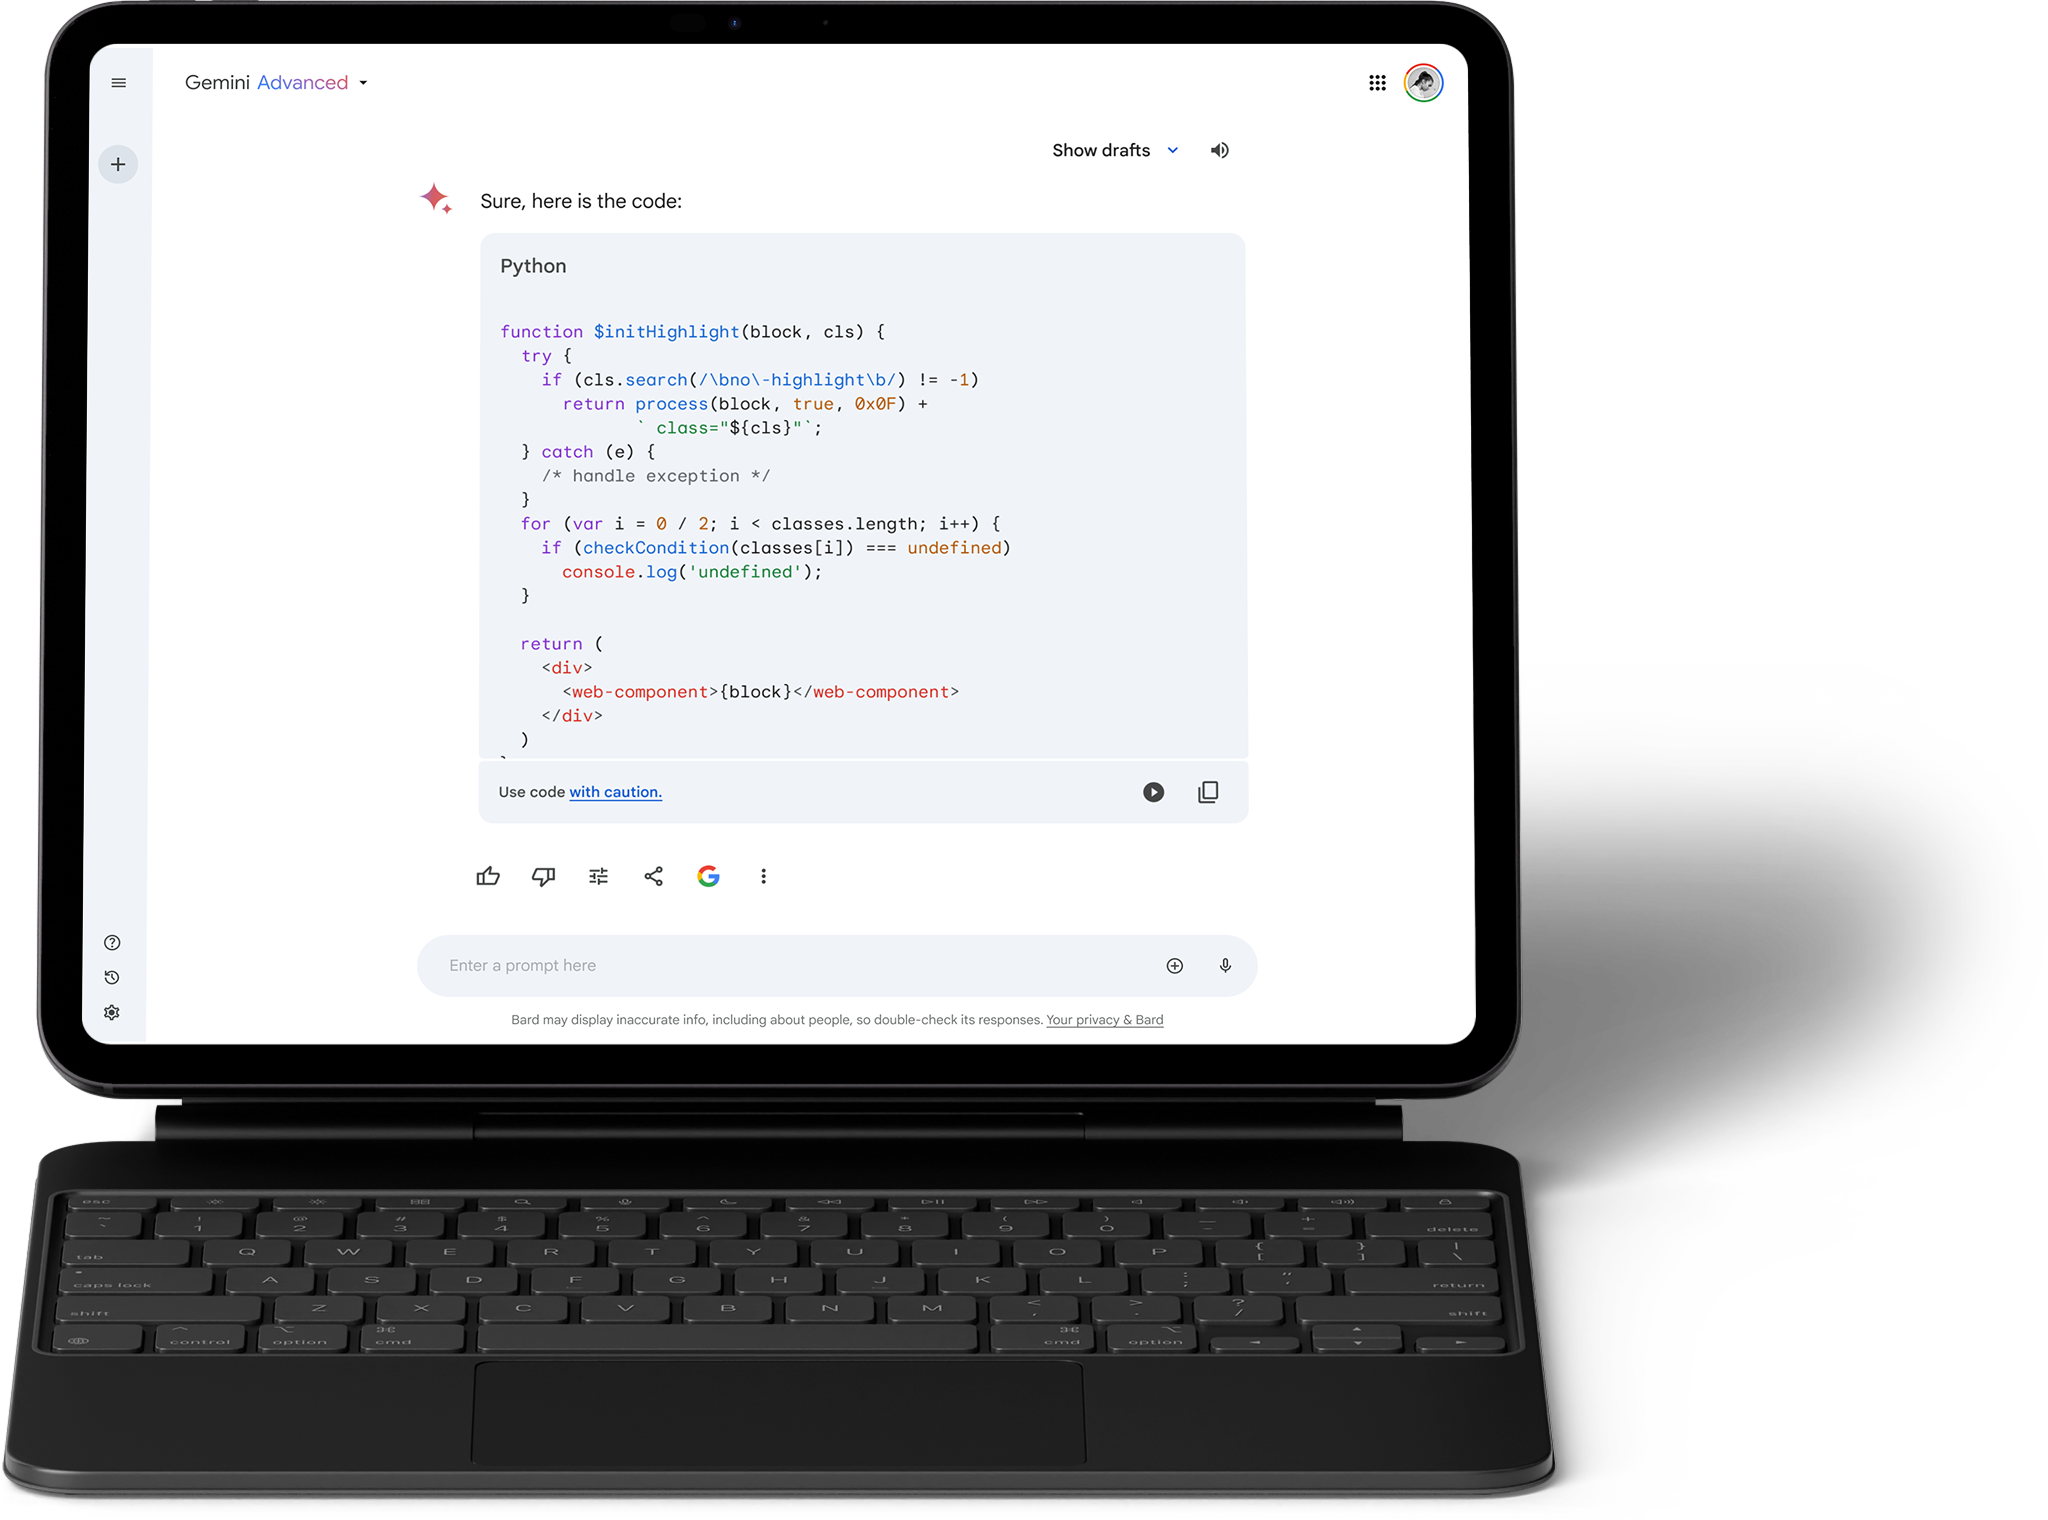
Visit gemini.google.com to create charts from any dataset (web/file) or have code generated for you.
I removed and hid confidential information in this case study to adhere to my non-disclosure agreement. All information in this case study is my own and may not necessarily reflect the views of Google.
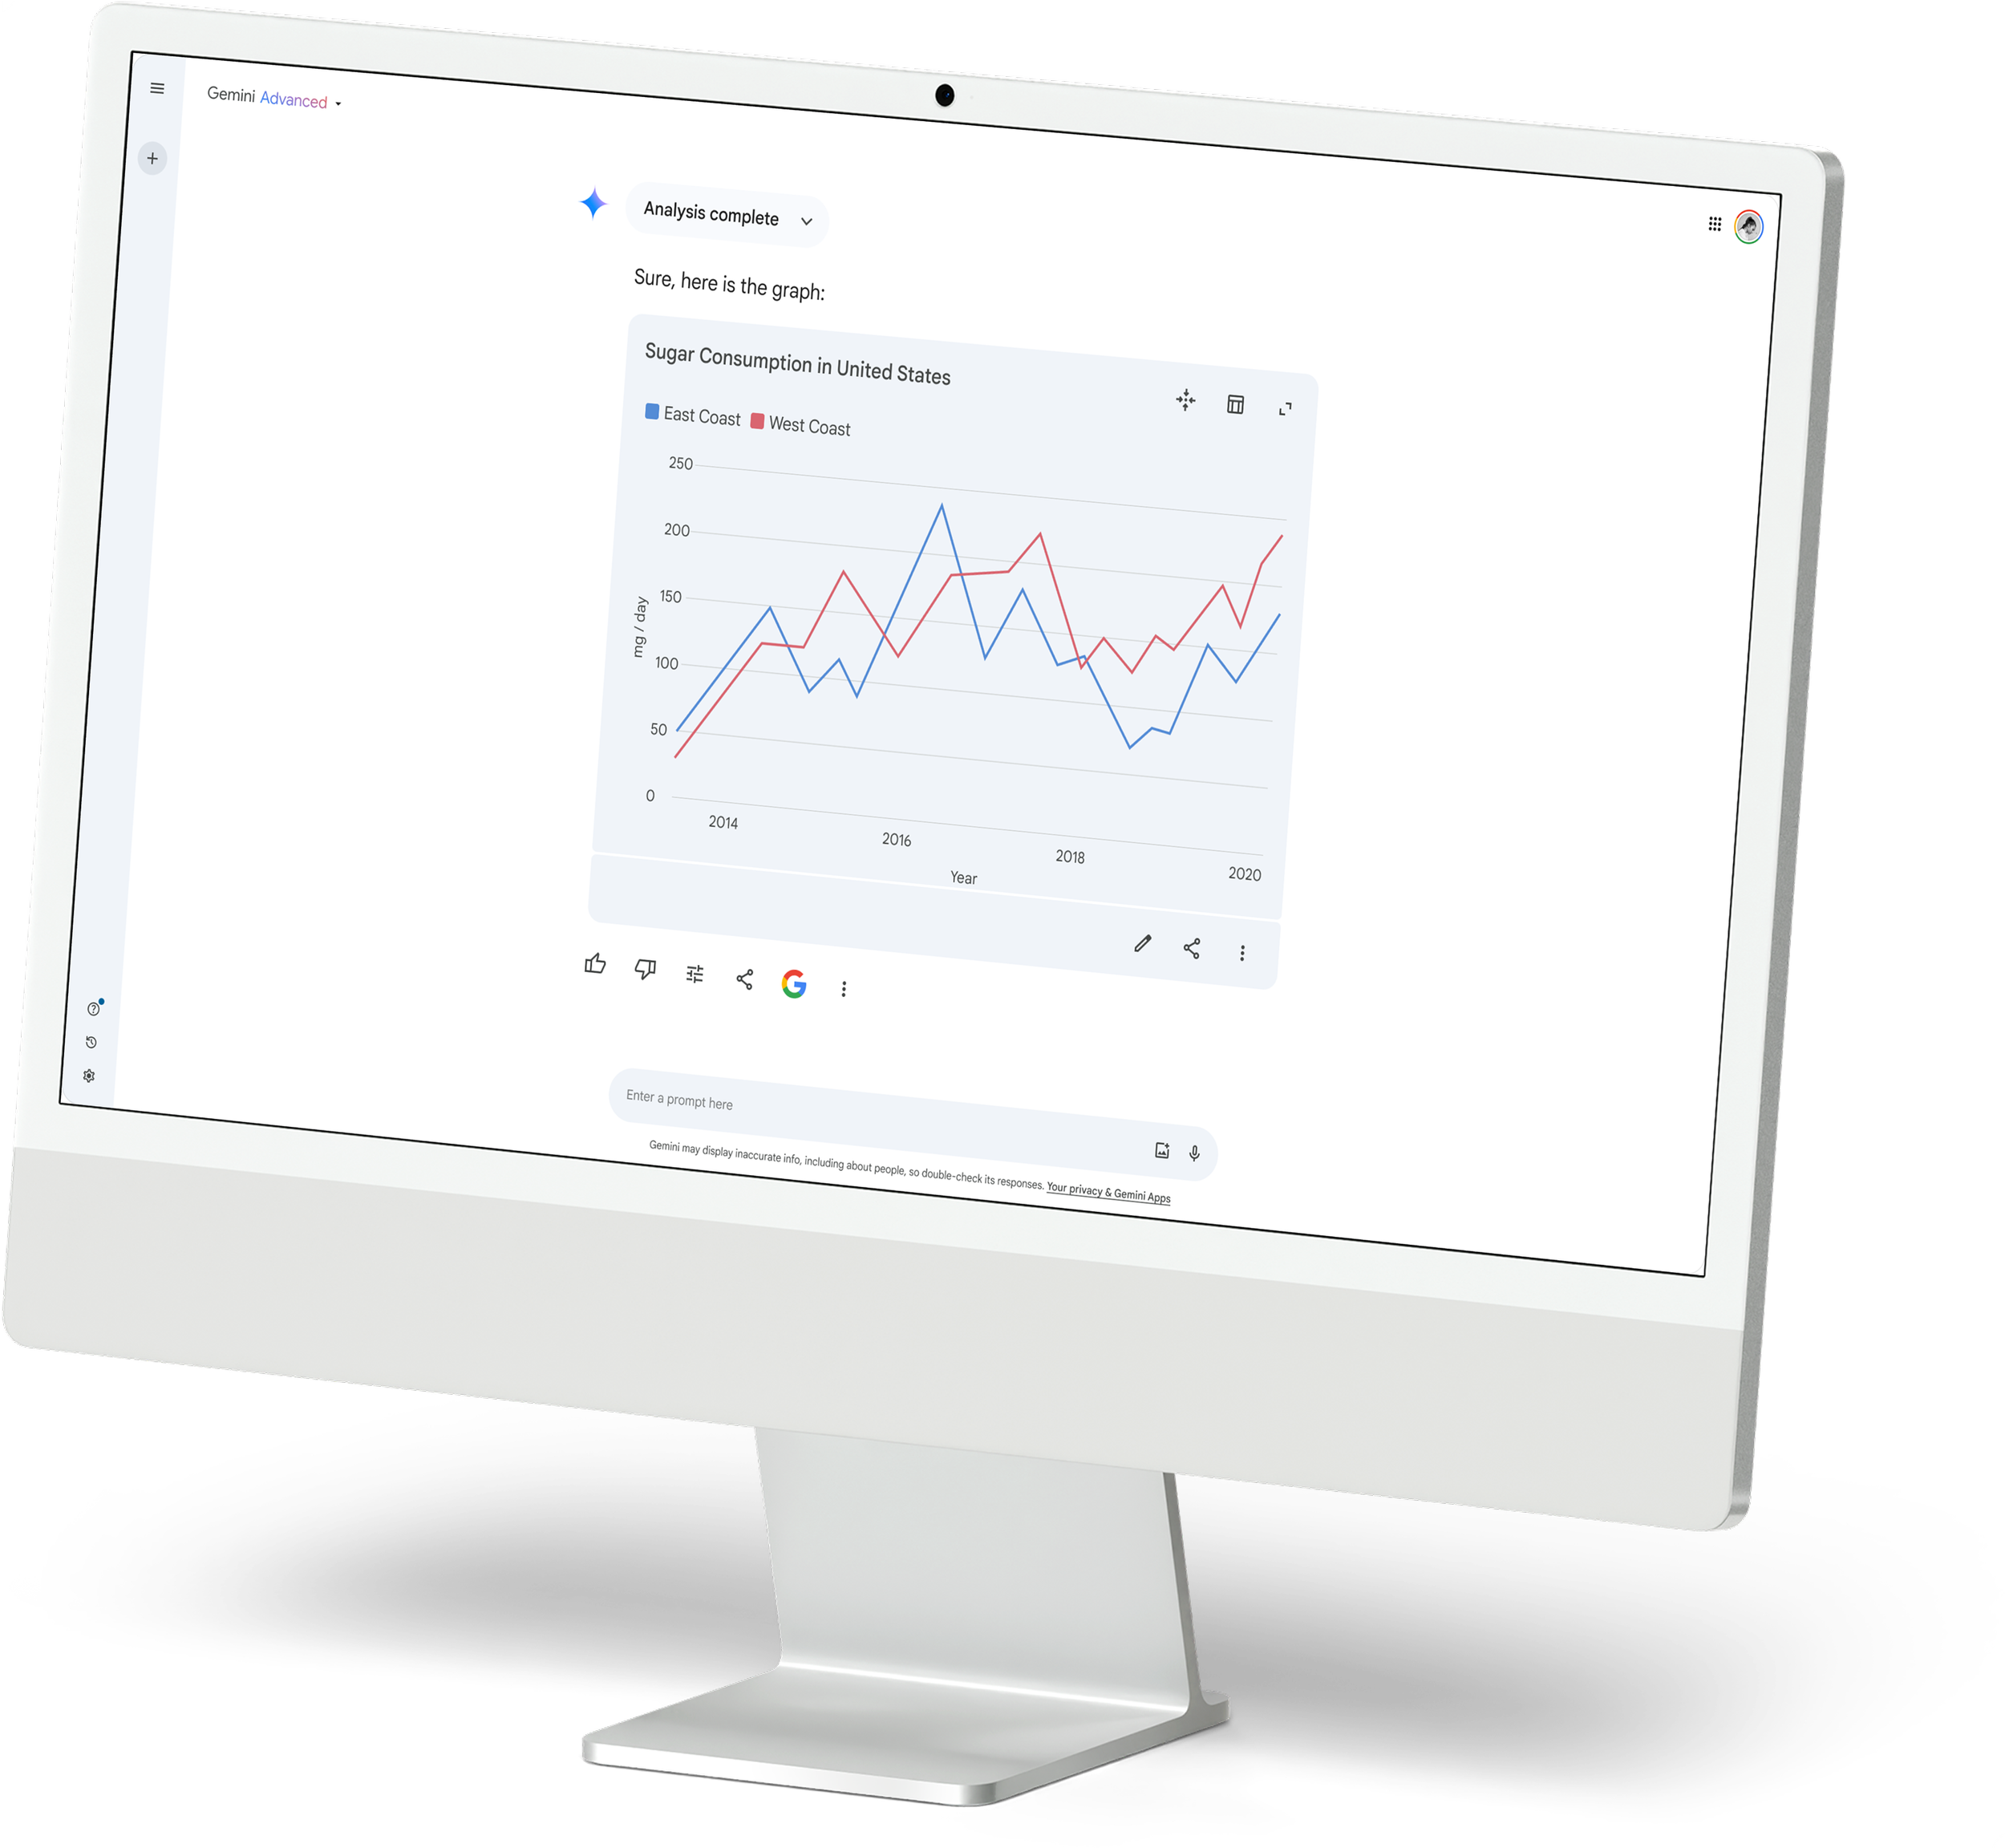 Select an image to view full size.
02. ROLE
tight timelines and ever-changing priorities
Our process: At the time of this writing, our team at Google Gemini relies on the core designers' guiding the pillars, which are informed by the model's capabilities to execute specific tasks. My role involves quickly progressing through ideation, collaborating with cross-functional partners (imageGen, Gemini work/enterprise, etc.), and delivering work that meets Google's quality standards.
The work: My role was to create a vision and provide two experiences (code/graphs) regarding how the model and user may interact on specific queries, such as graphs and code. If you're curious about what implicit code means, check out our logic-based reasoning update here and read more here.
The culture: With 90% of my product team (Product Managers and Engineers) working in time zones that differ from mine by 3 to 9 hours, we adapted our workflow to prioritize asynchronous communication. We focused on delivering comprehensive end-to-end journey documentation and detailed prototypes to ensure effective collaboration despite our limited overlap in working hours.
03. KEY CHALLENGES
Shipping code and graph user experience in a large, dynamic environment.
Challenge
TL;DR: Transitioning model capacities requires multiple UX candidates.
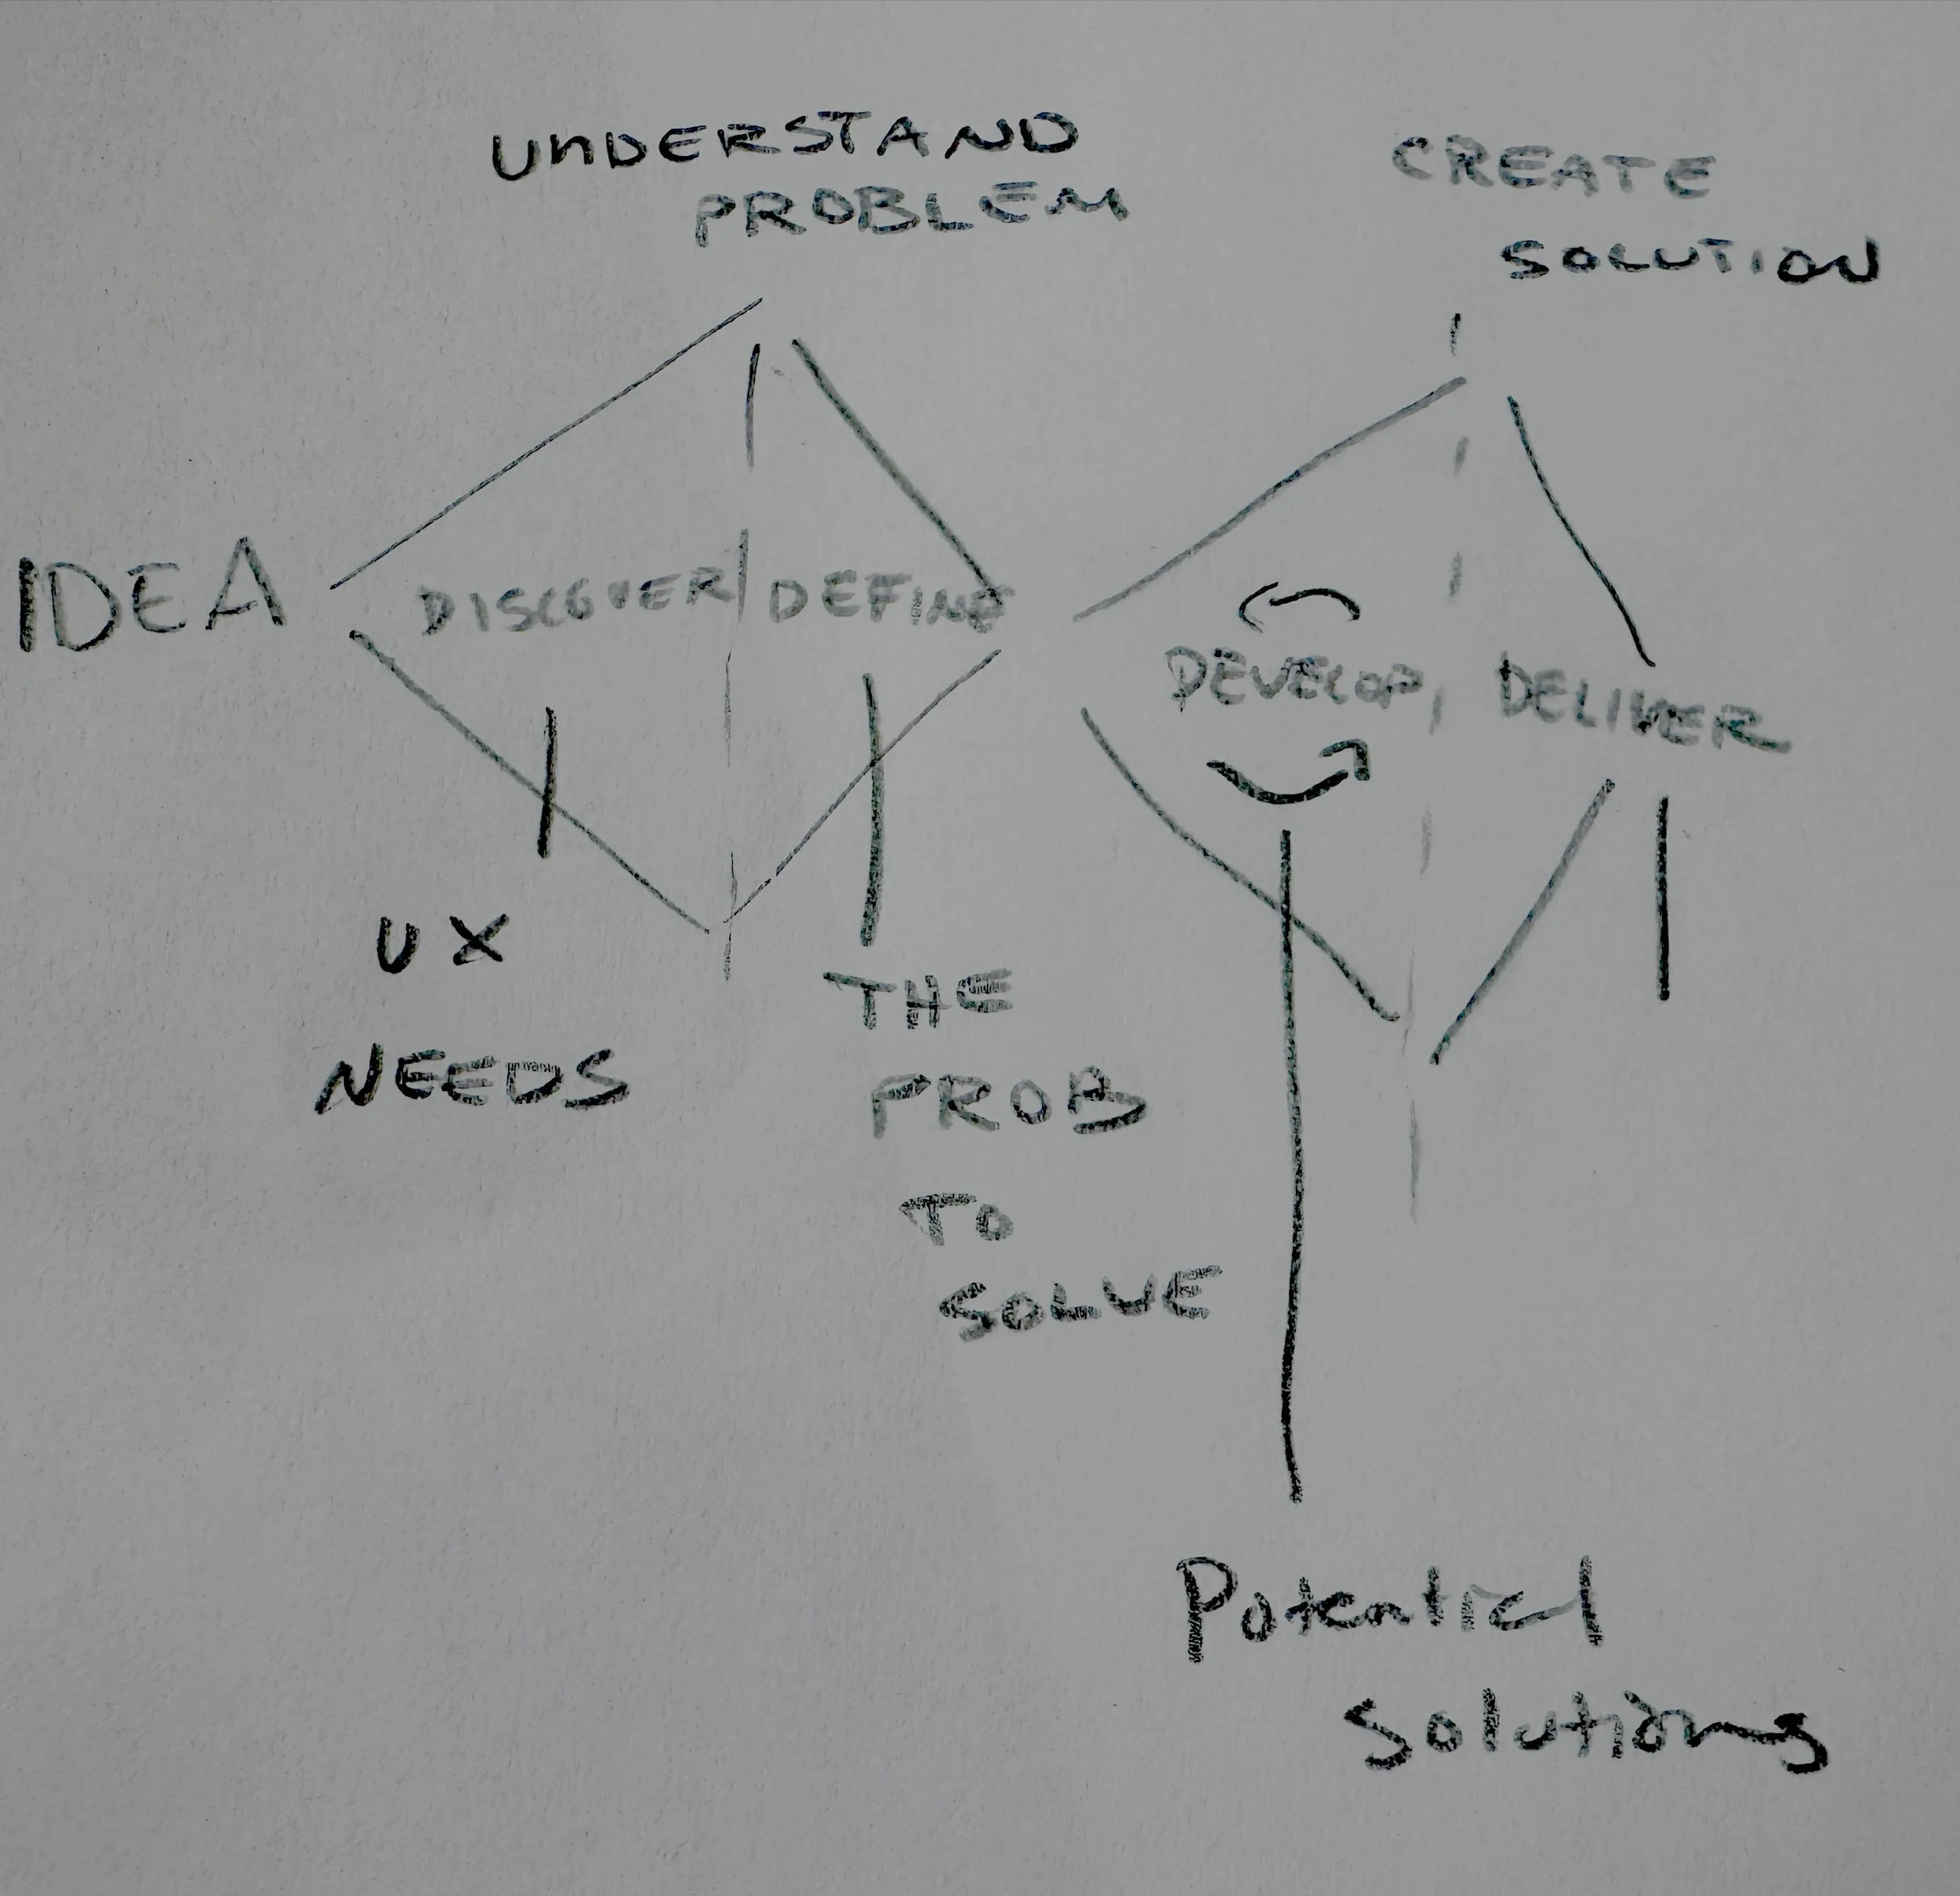
Our three model candidates progress through three stages: work (delivery of asset: code/graph), sage + work (delivery and summary of decisions made), and work + wingman (delivery and the ability to explain, troubleshoot, and guide through decisions with resources step by step).
Solution
TL;DR: Develop a range of cohesive solutions (good, better, best) so we are prepared to ship with the right choice for our model candidates.
A clear vision of the patterns necessary to create an effective canvas or workspace that fosters collaboration and clear thinking. Apply systems thinking to ensure coherence and cohesion, avoiding the reinvention of patterns across pillars by leveraging the Google Material Design Library and minimal UX solutions (see Conway's Law).
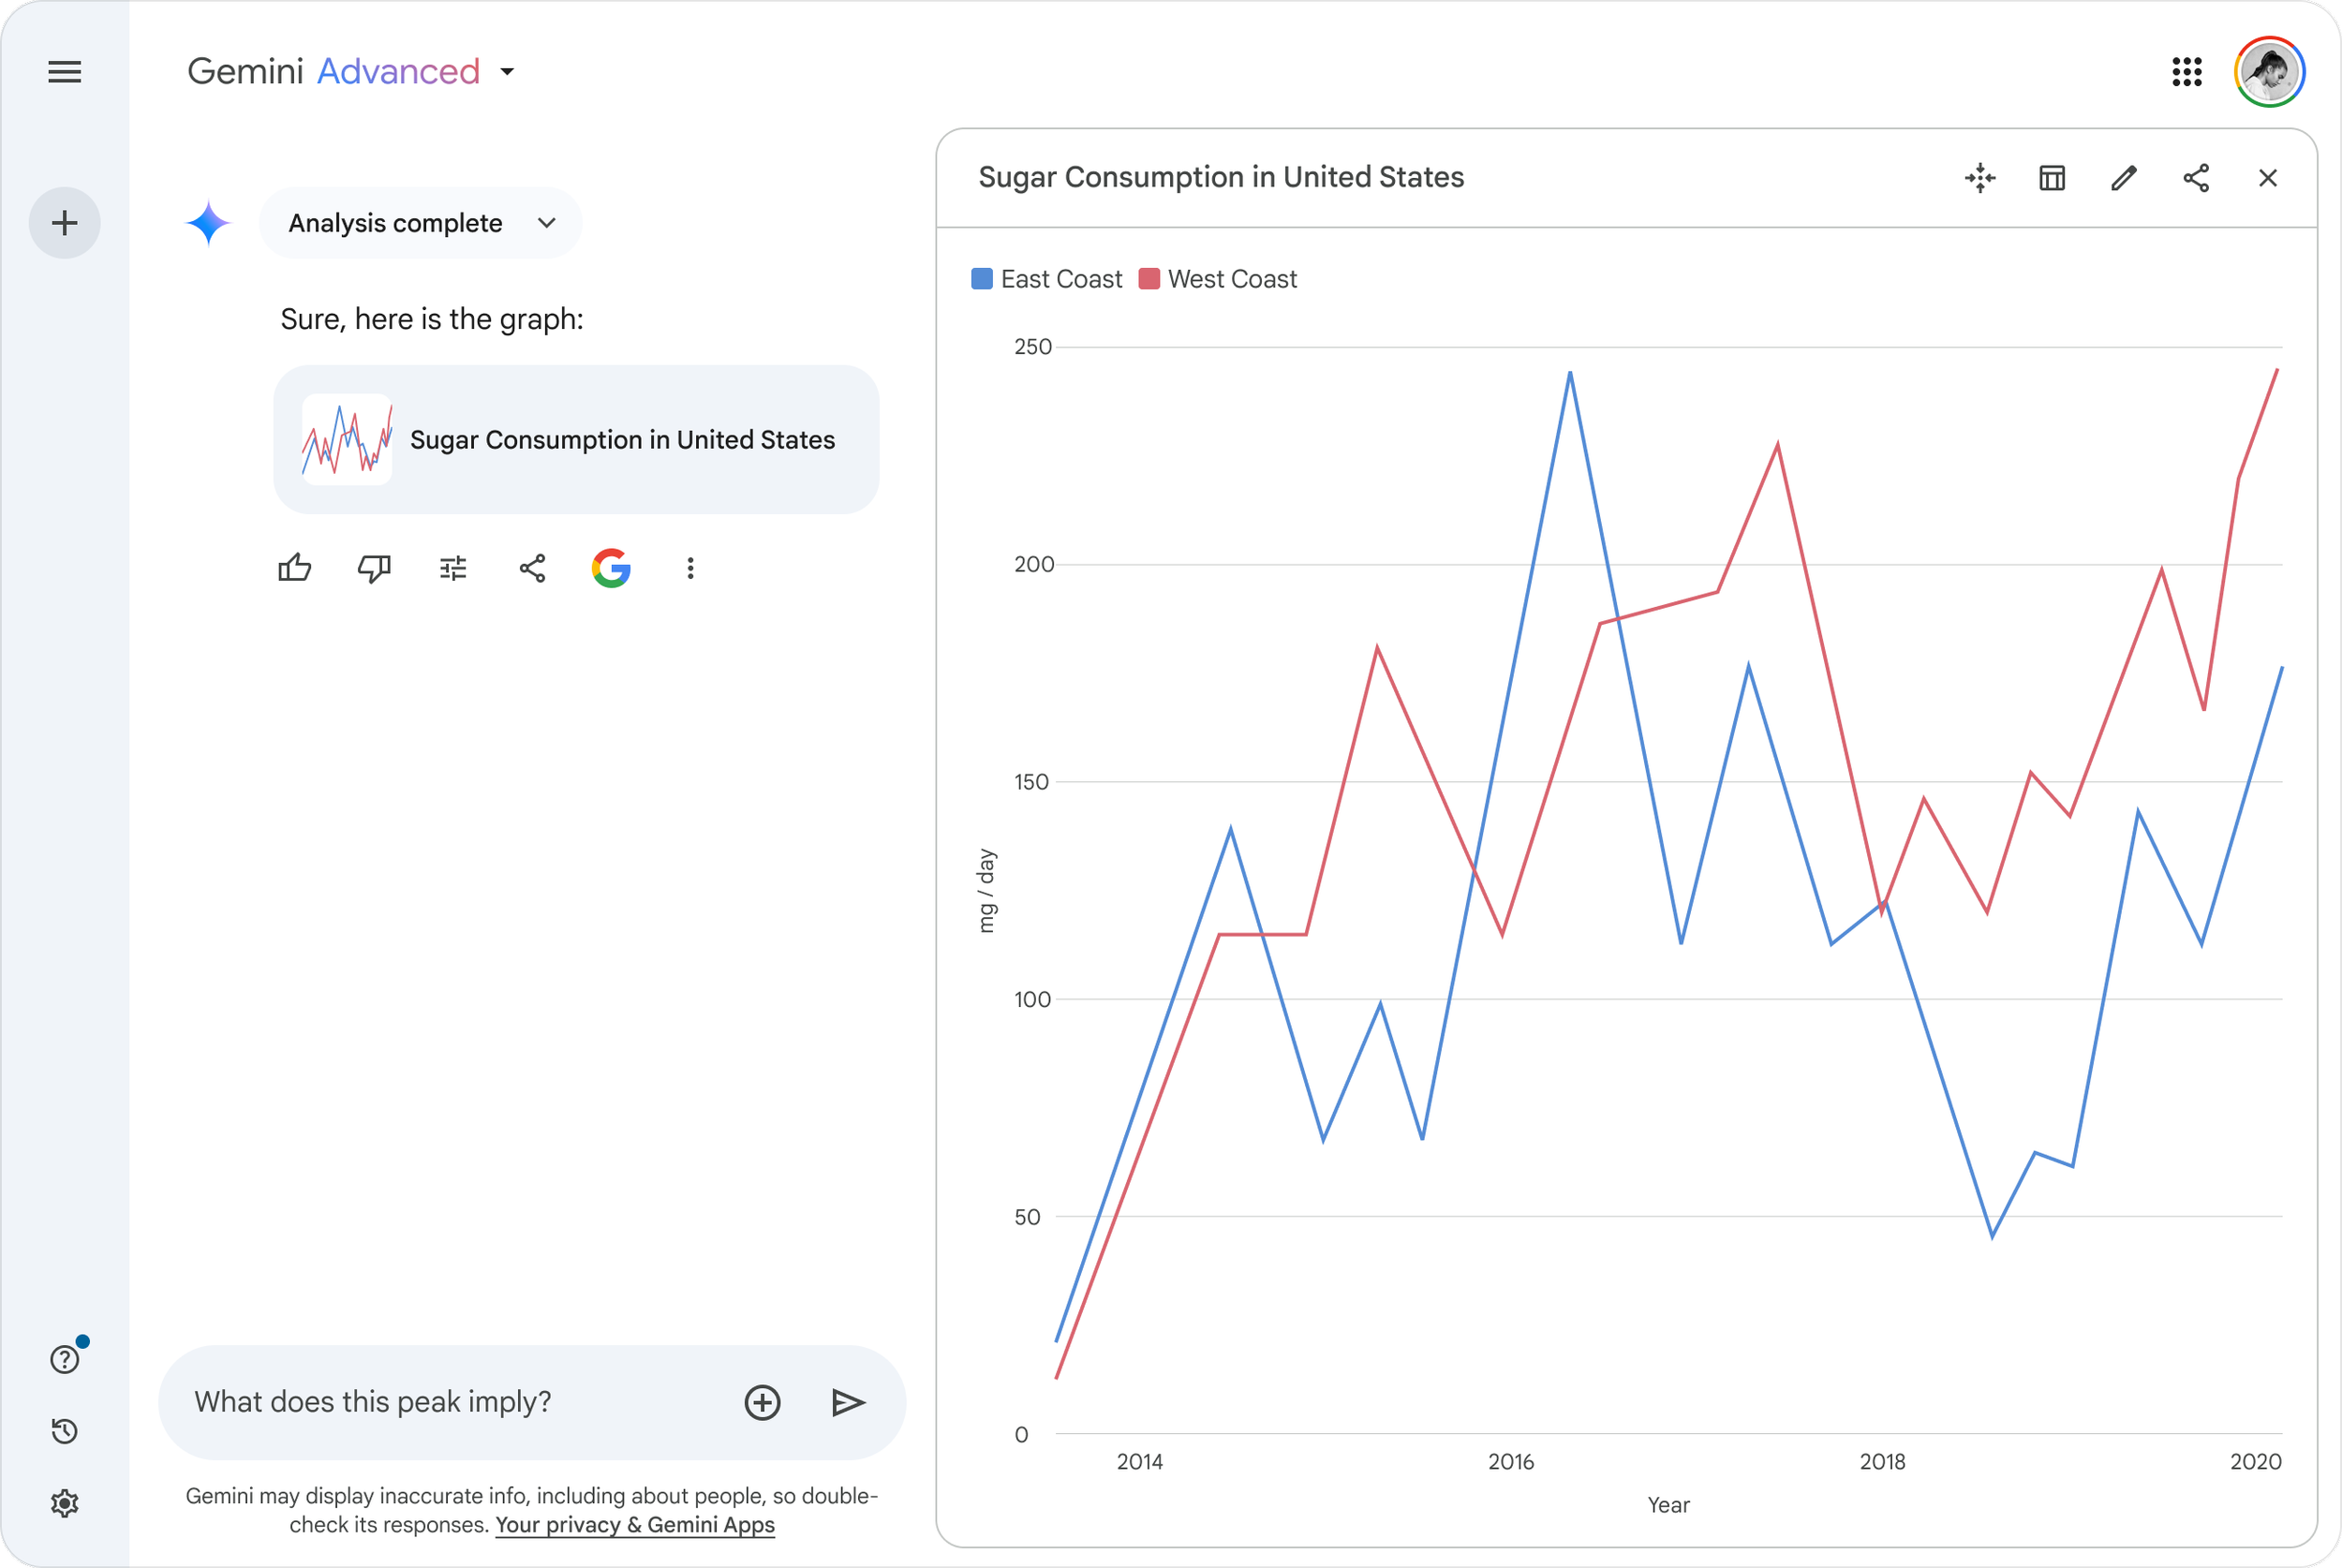
04a. Solutions — GRAPHS
Good (shipped)
Better (limited release)
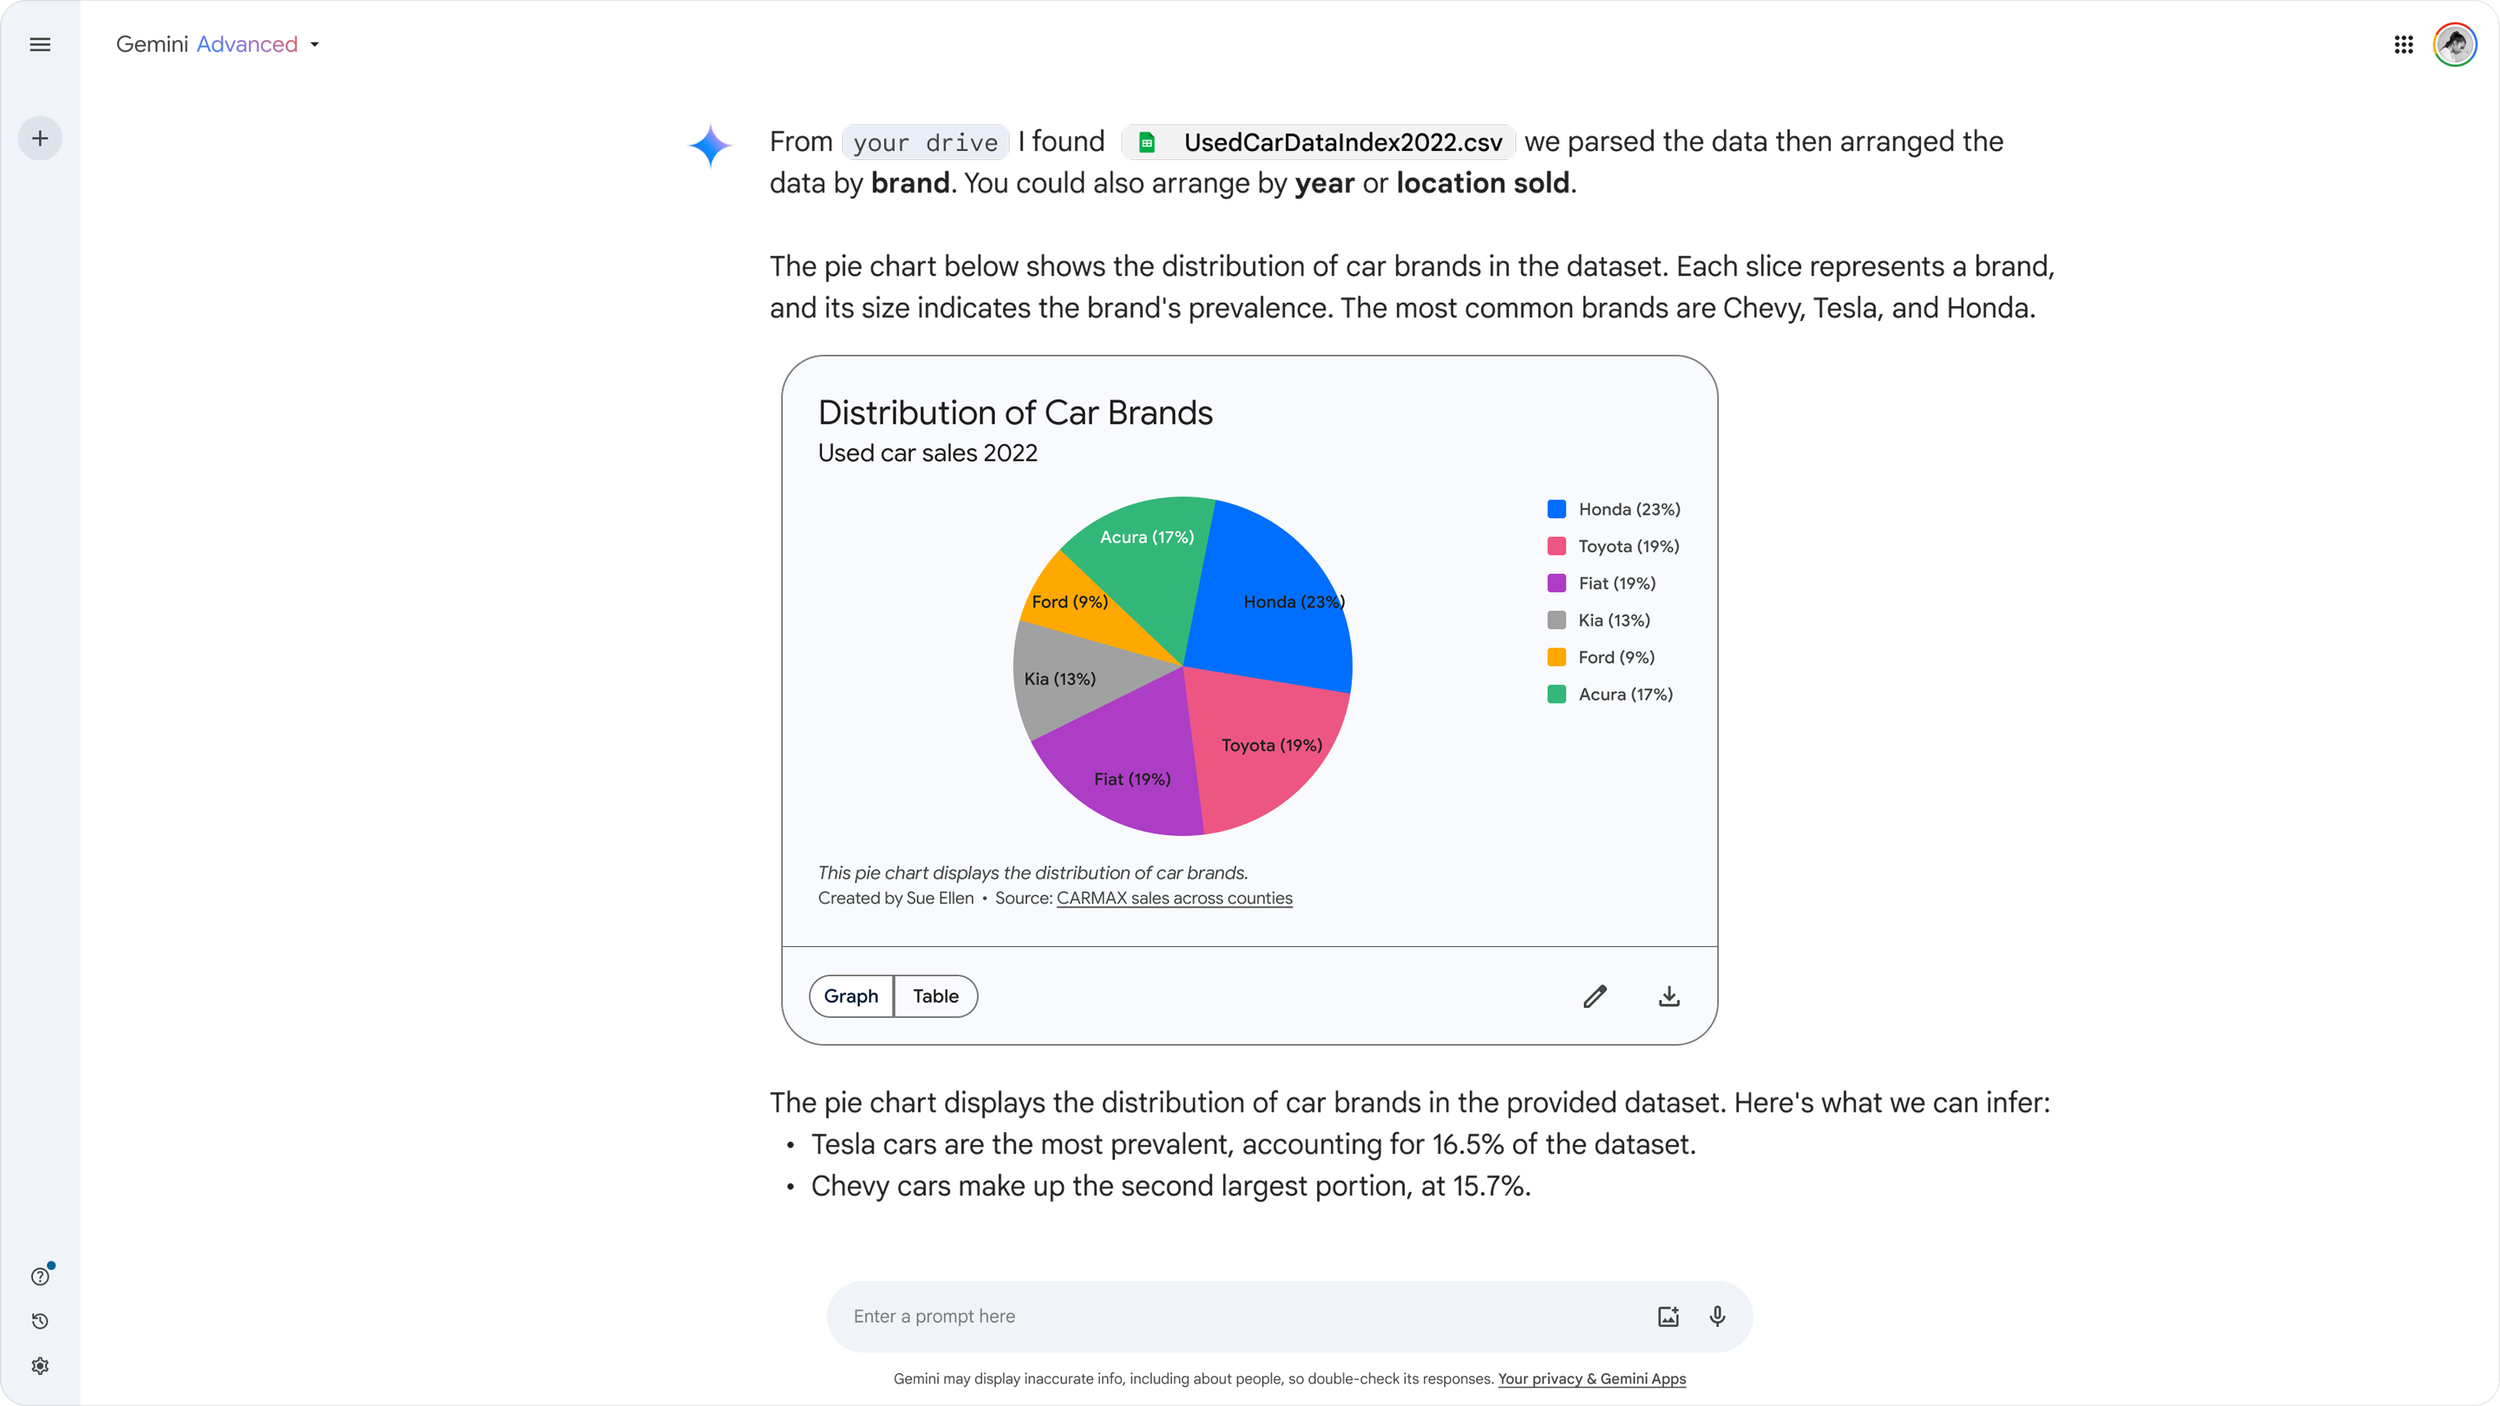
Best (did not ship)
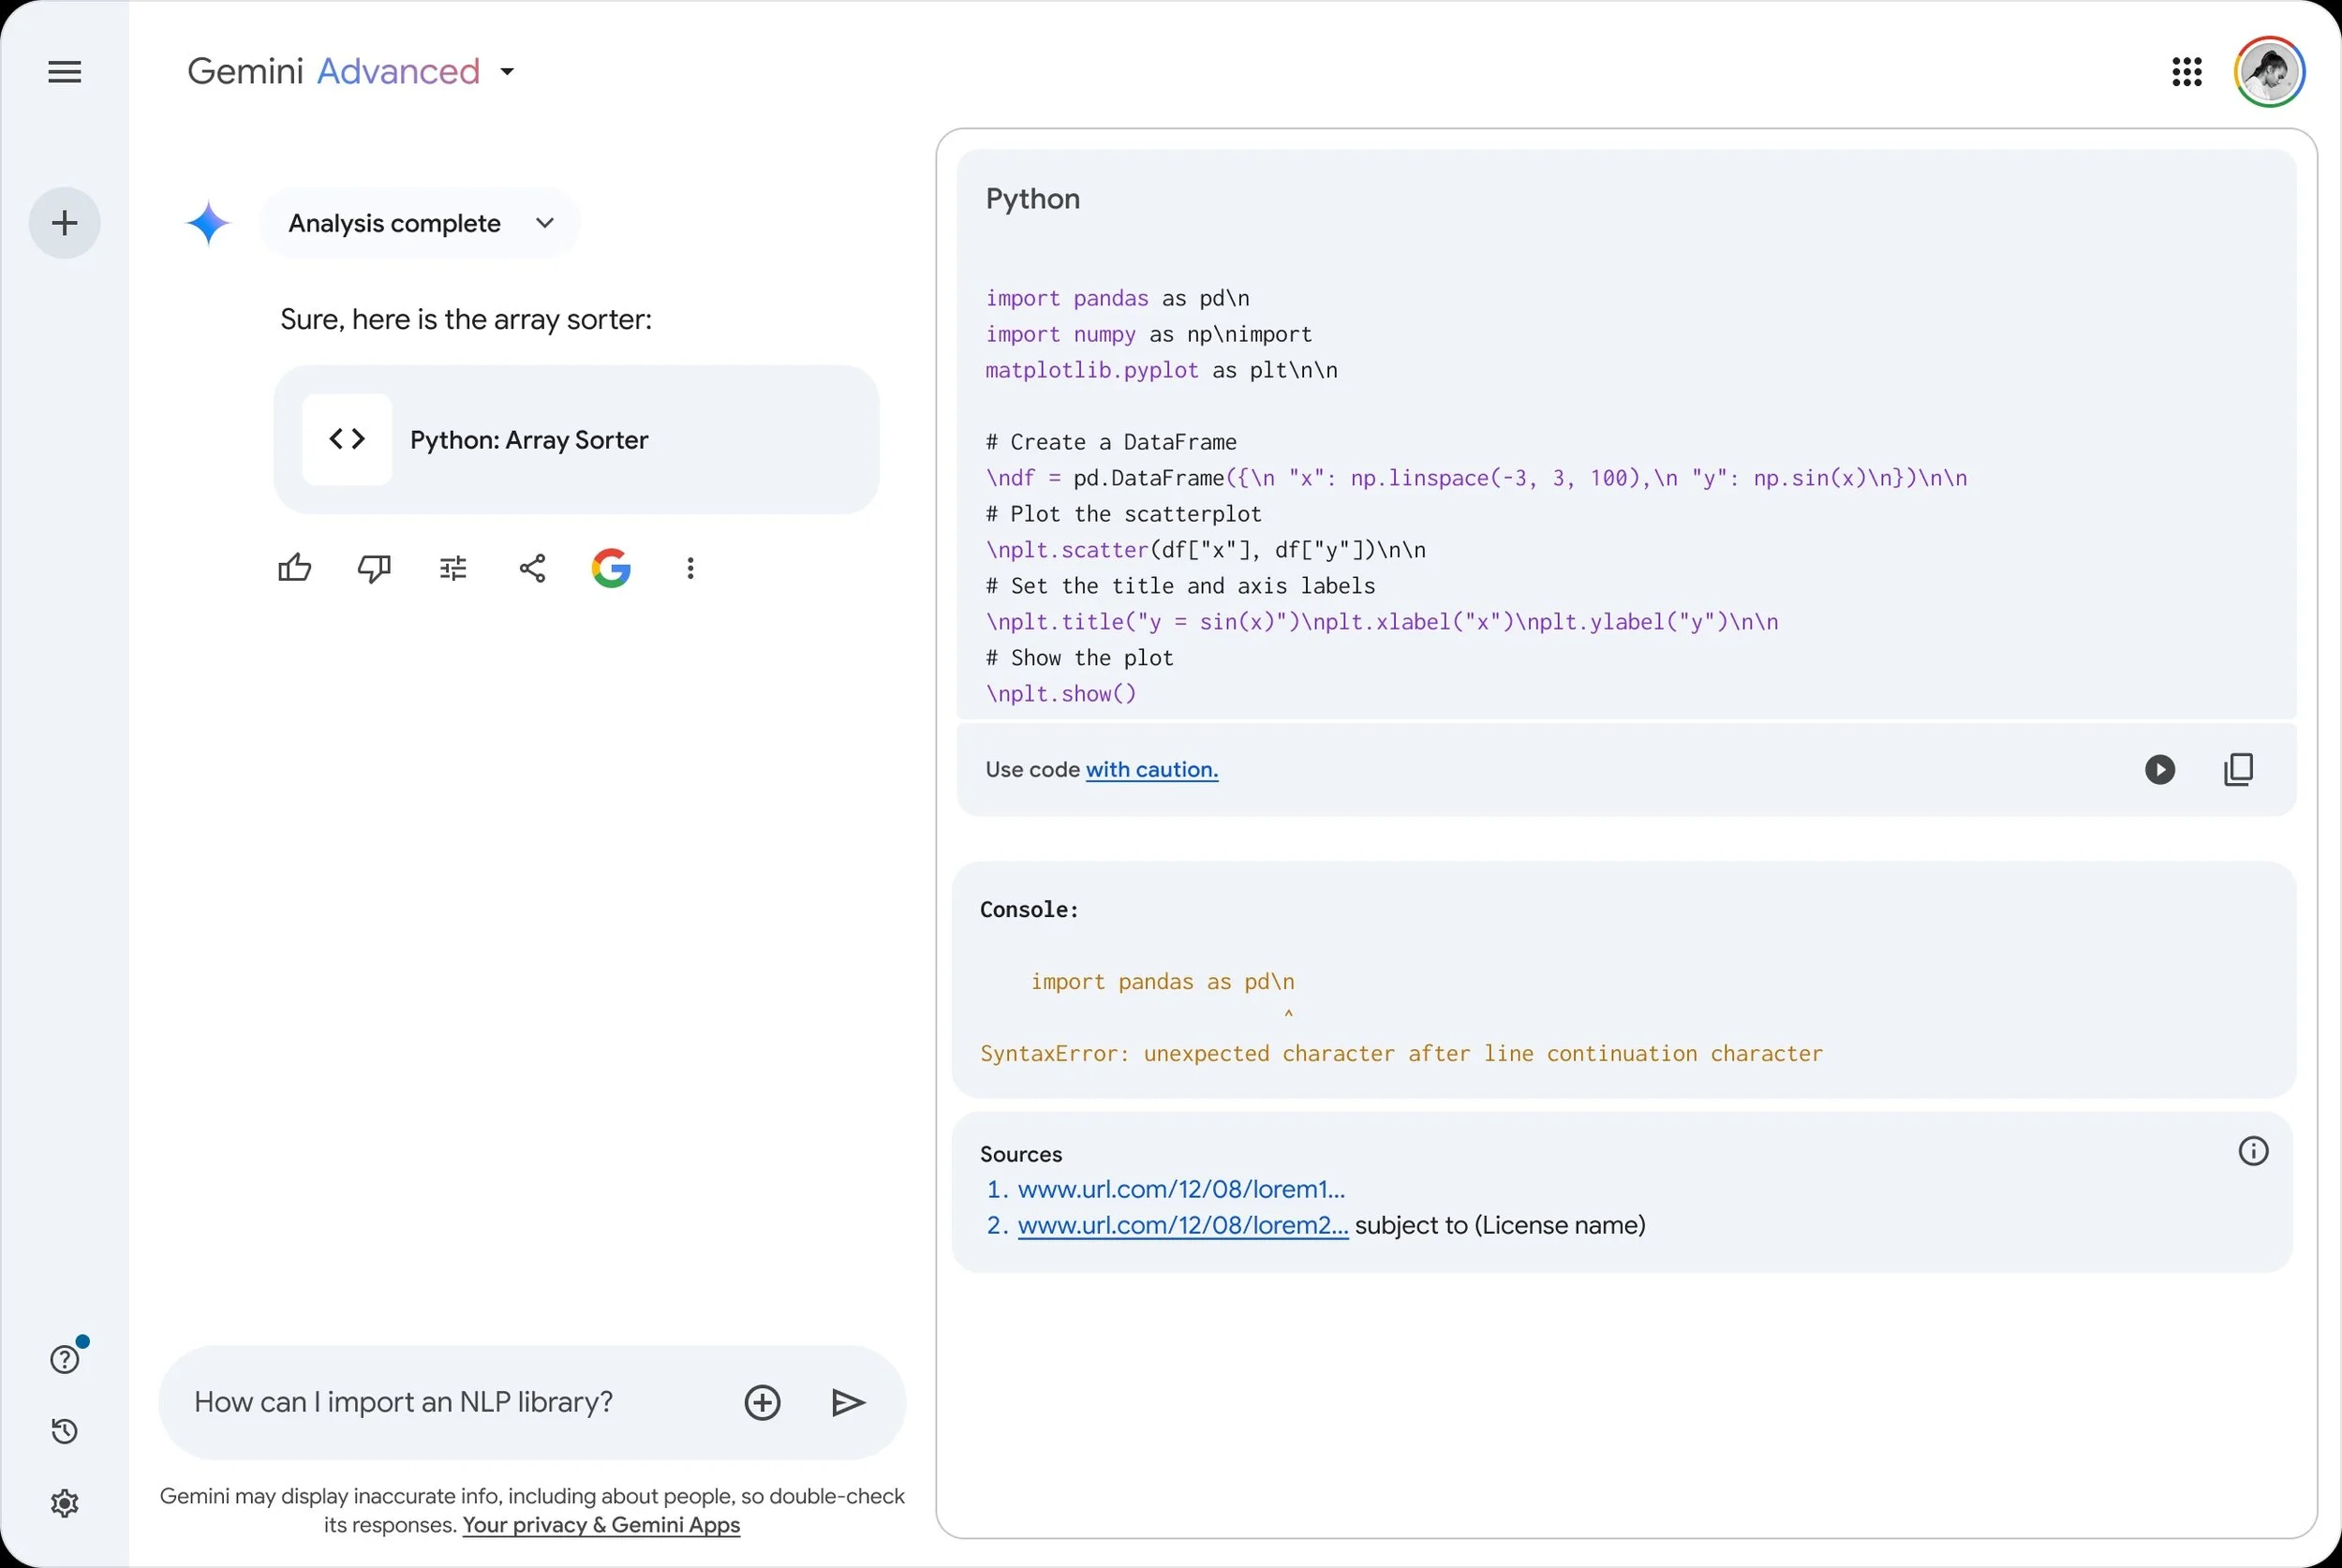
04b. Solutions — CODE
Good (shipped)
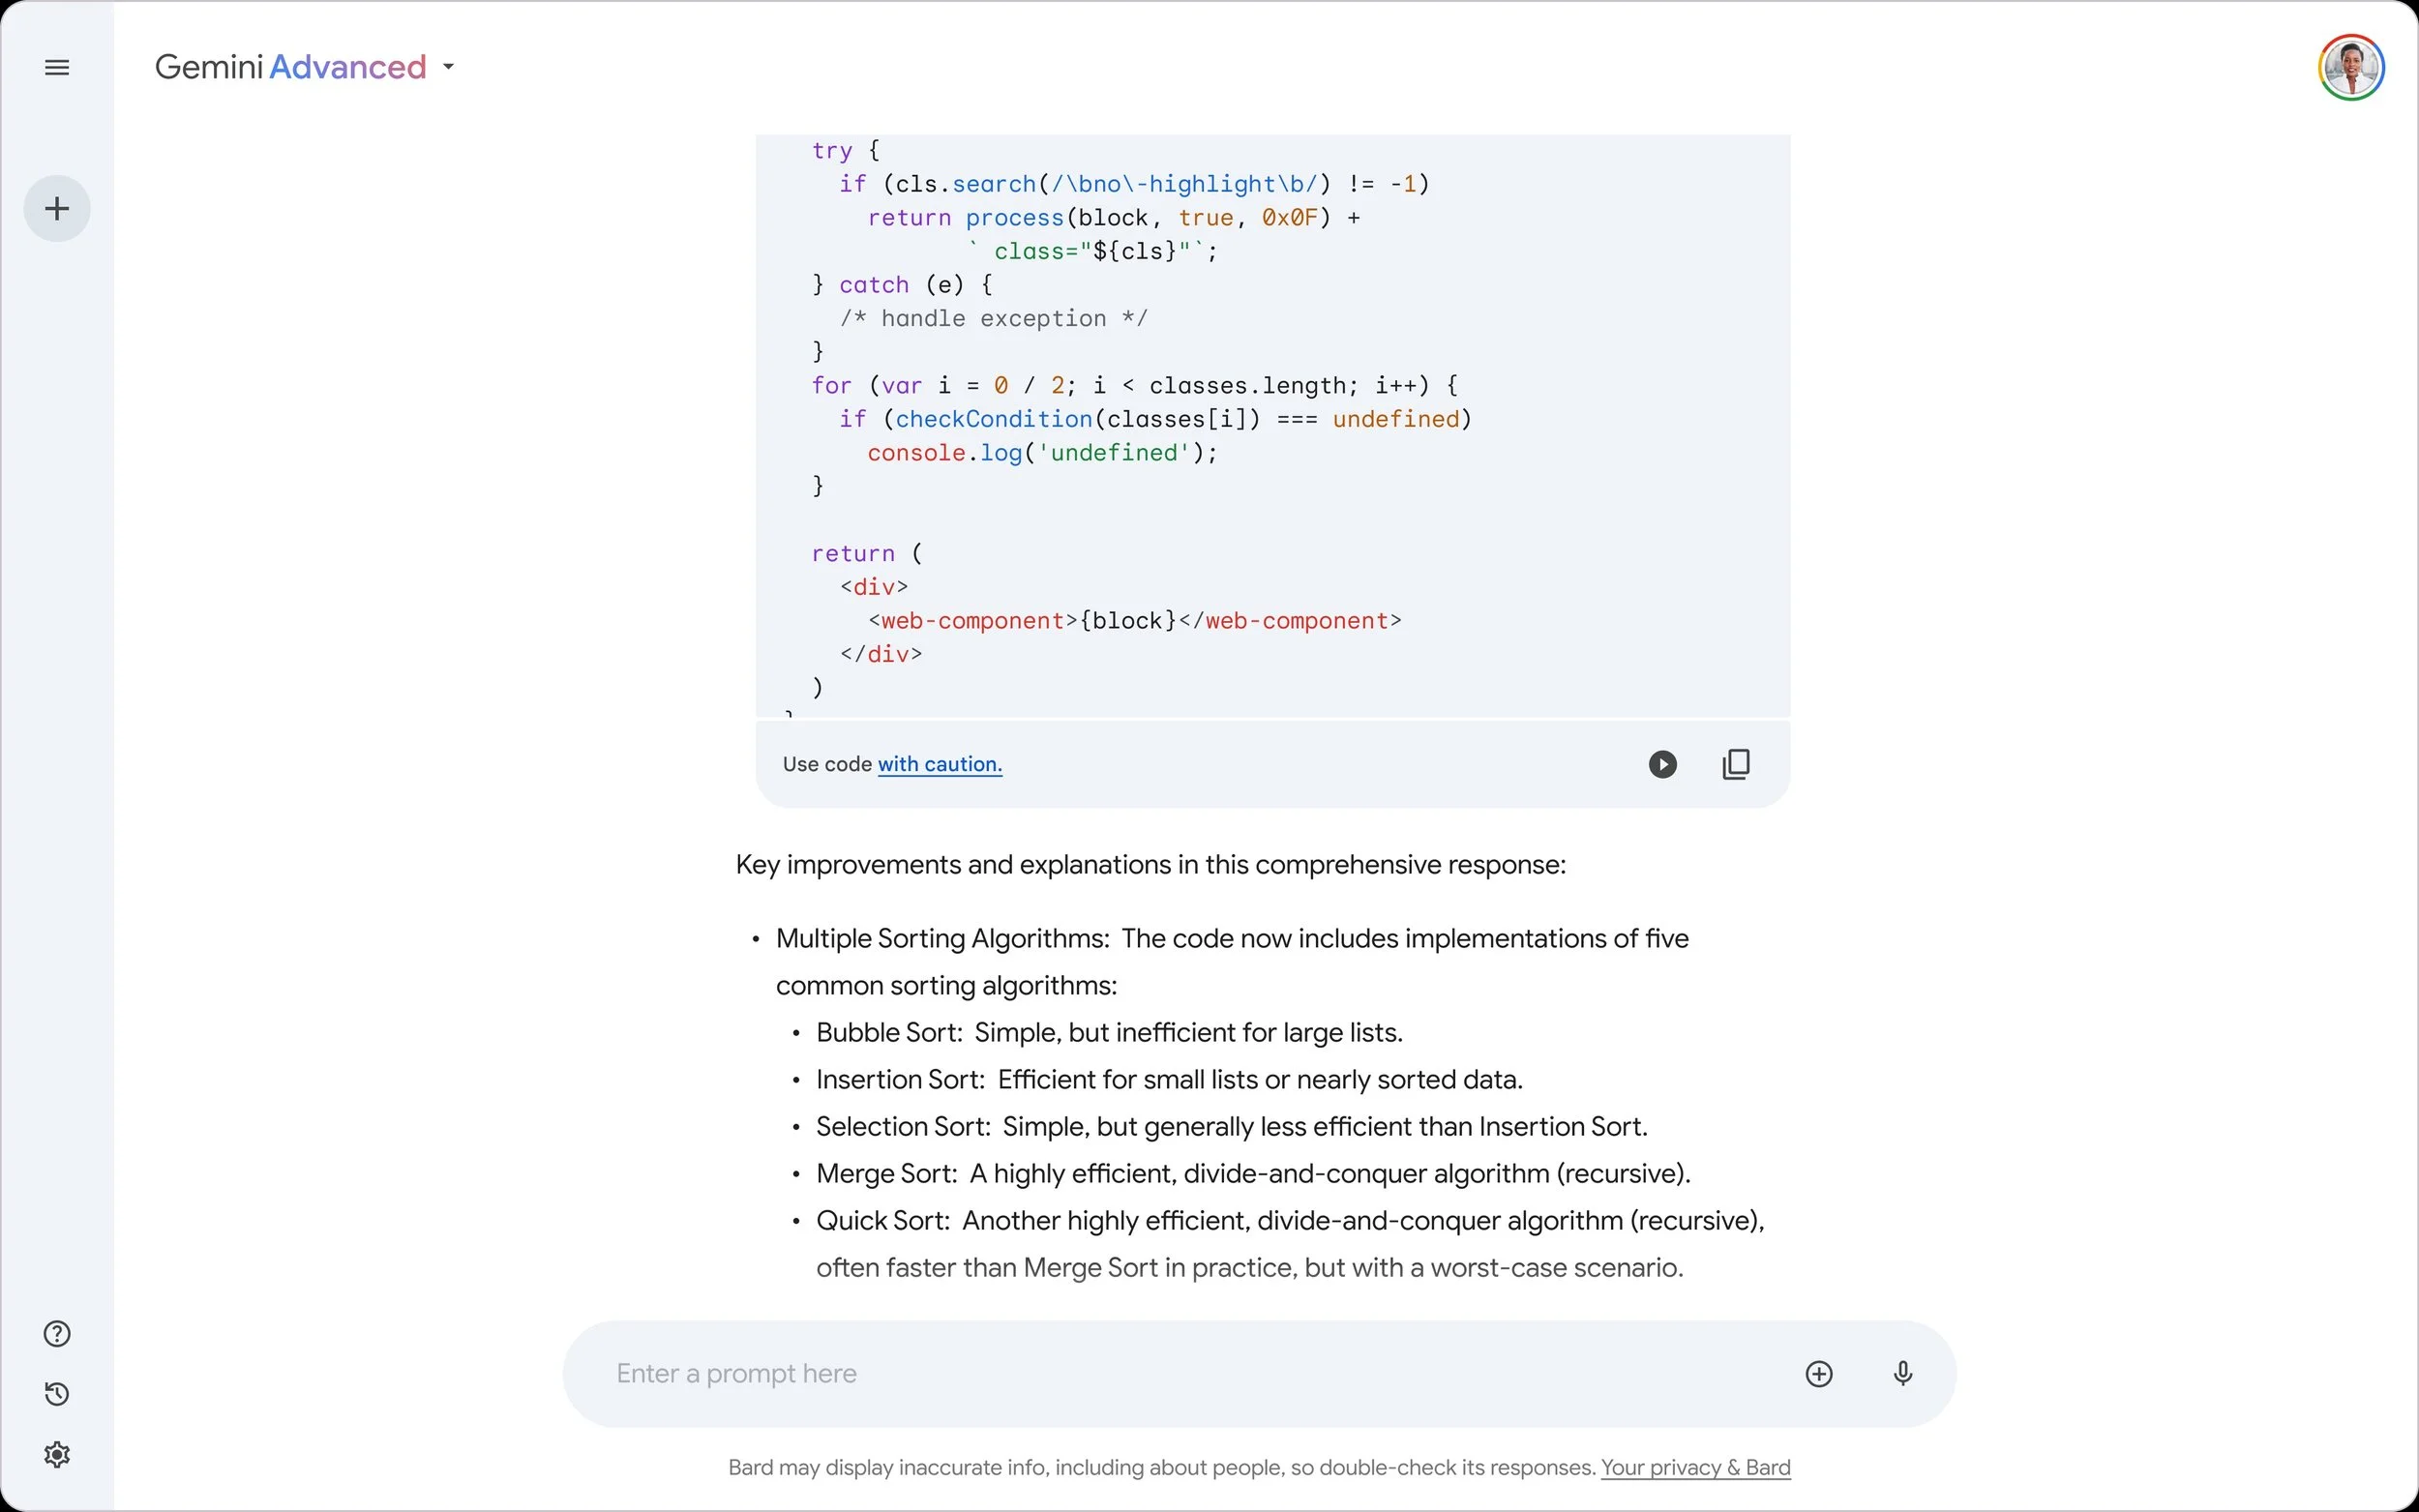
Better (limited release)
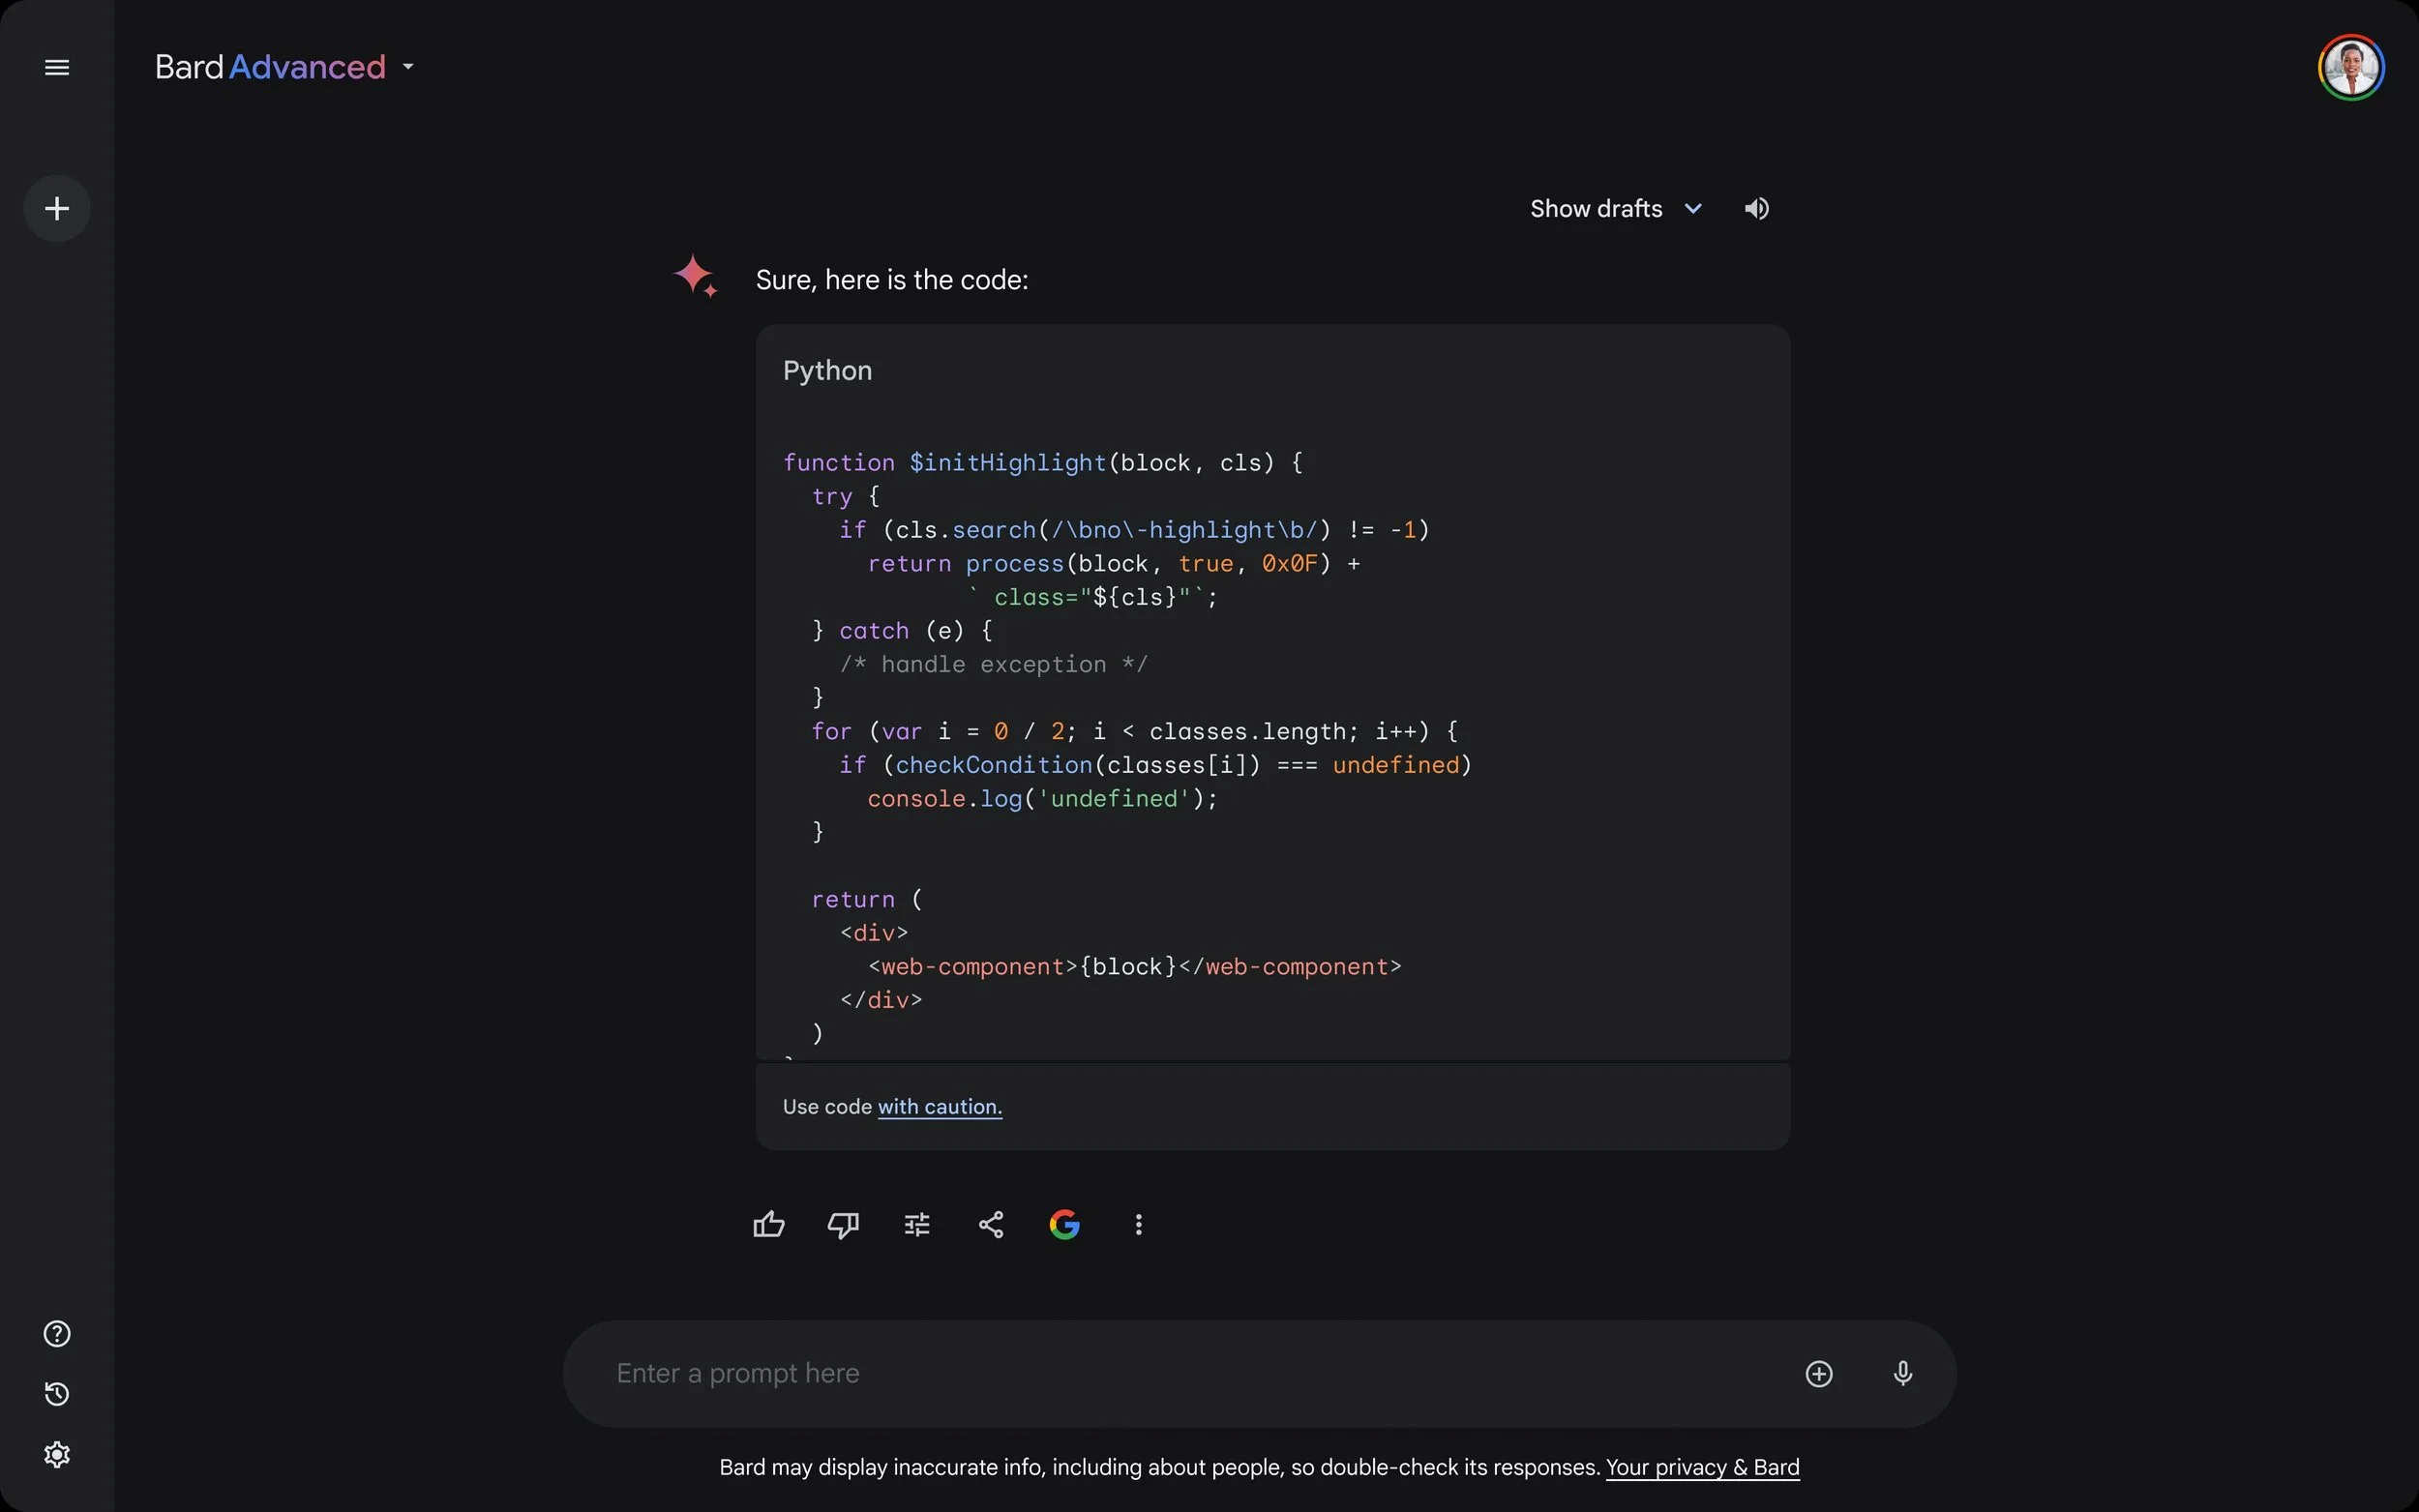
Best (not shipped)
05. ABRIDGED CASE STUDY — AUDIT FOR GRAPH DESIGN SYSTEM
GRAPHS: The beginning (DESIGN SYSTEM)
Discovery: Our model excelled at generating graphs in Python. At that time, the widely supported standard was Matlab, and I suggested using the Seaborn Visual Library for our initial round of testing (we later discovered that GPT also used the same library for production).
Discovery: Pursuing a cohesive visual language for user comfort (aligned with the material design system) and brand recognition. Our commitment to a premium and consistent project.
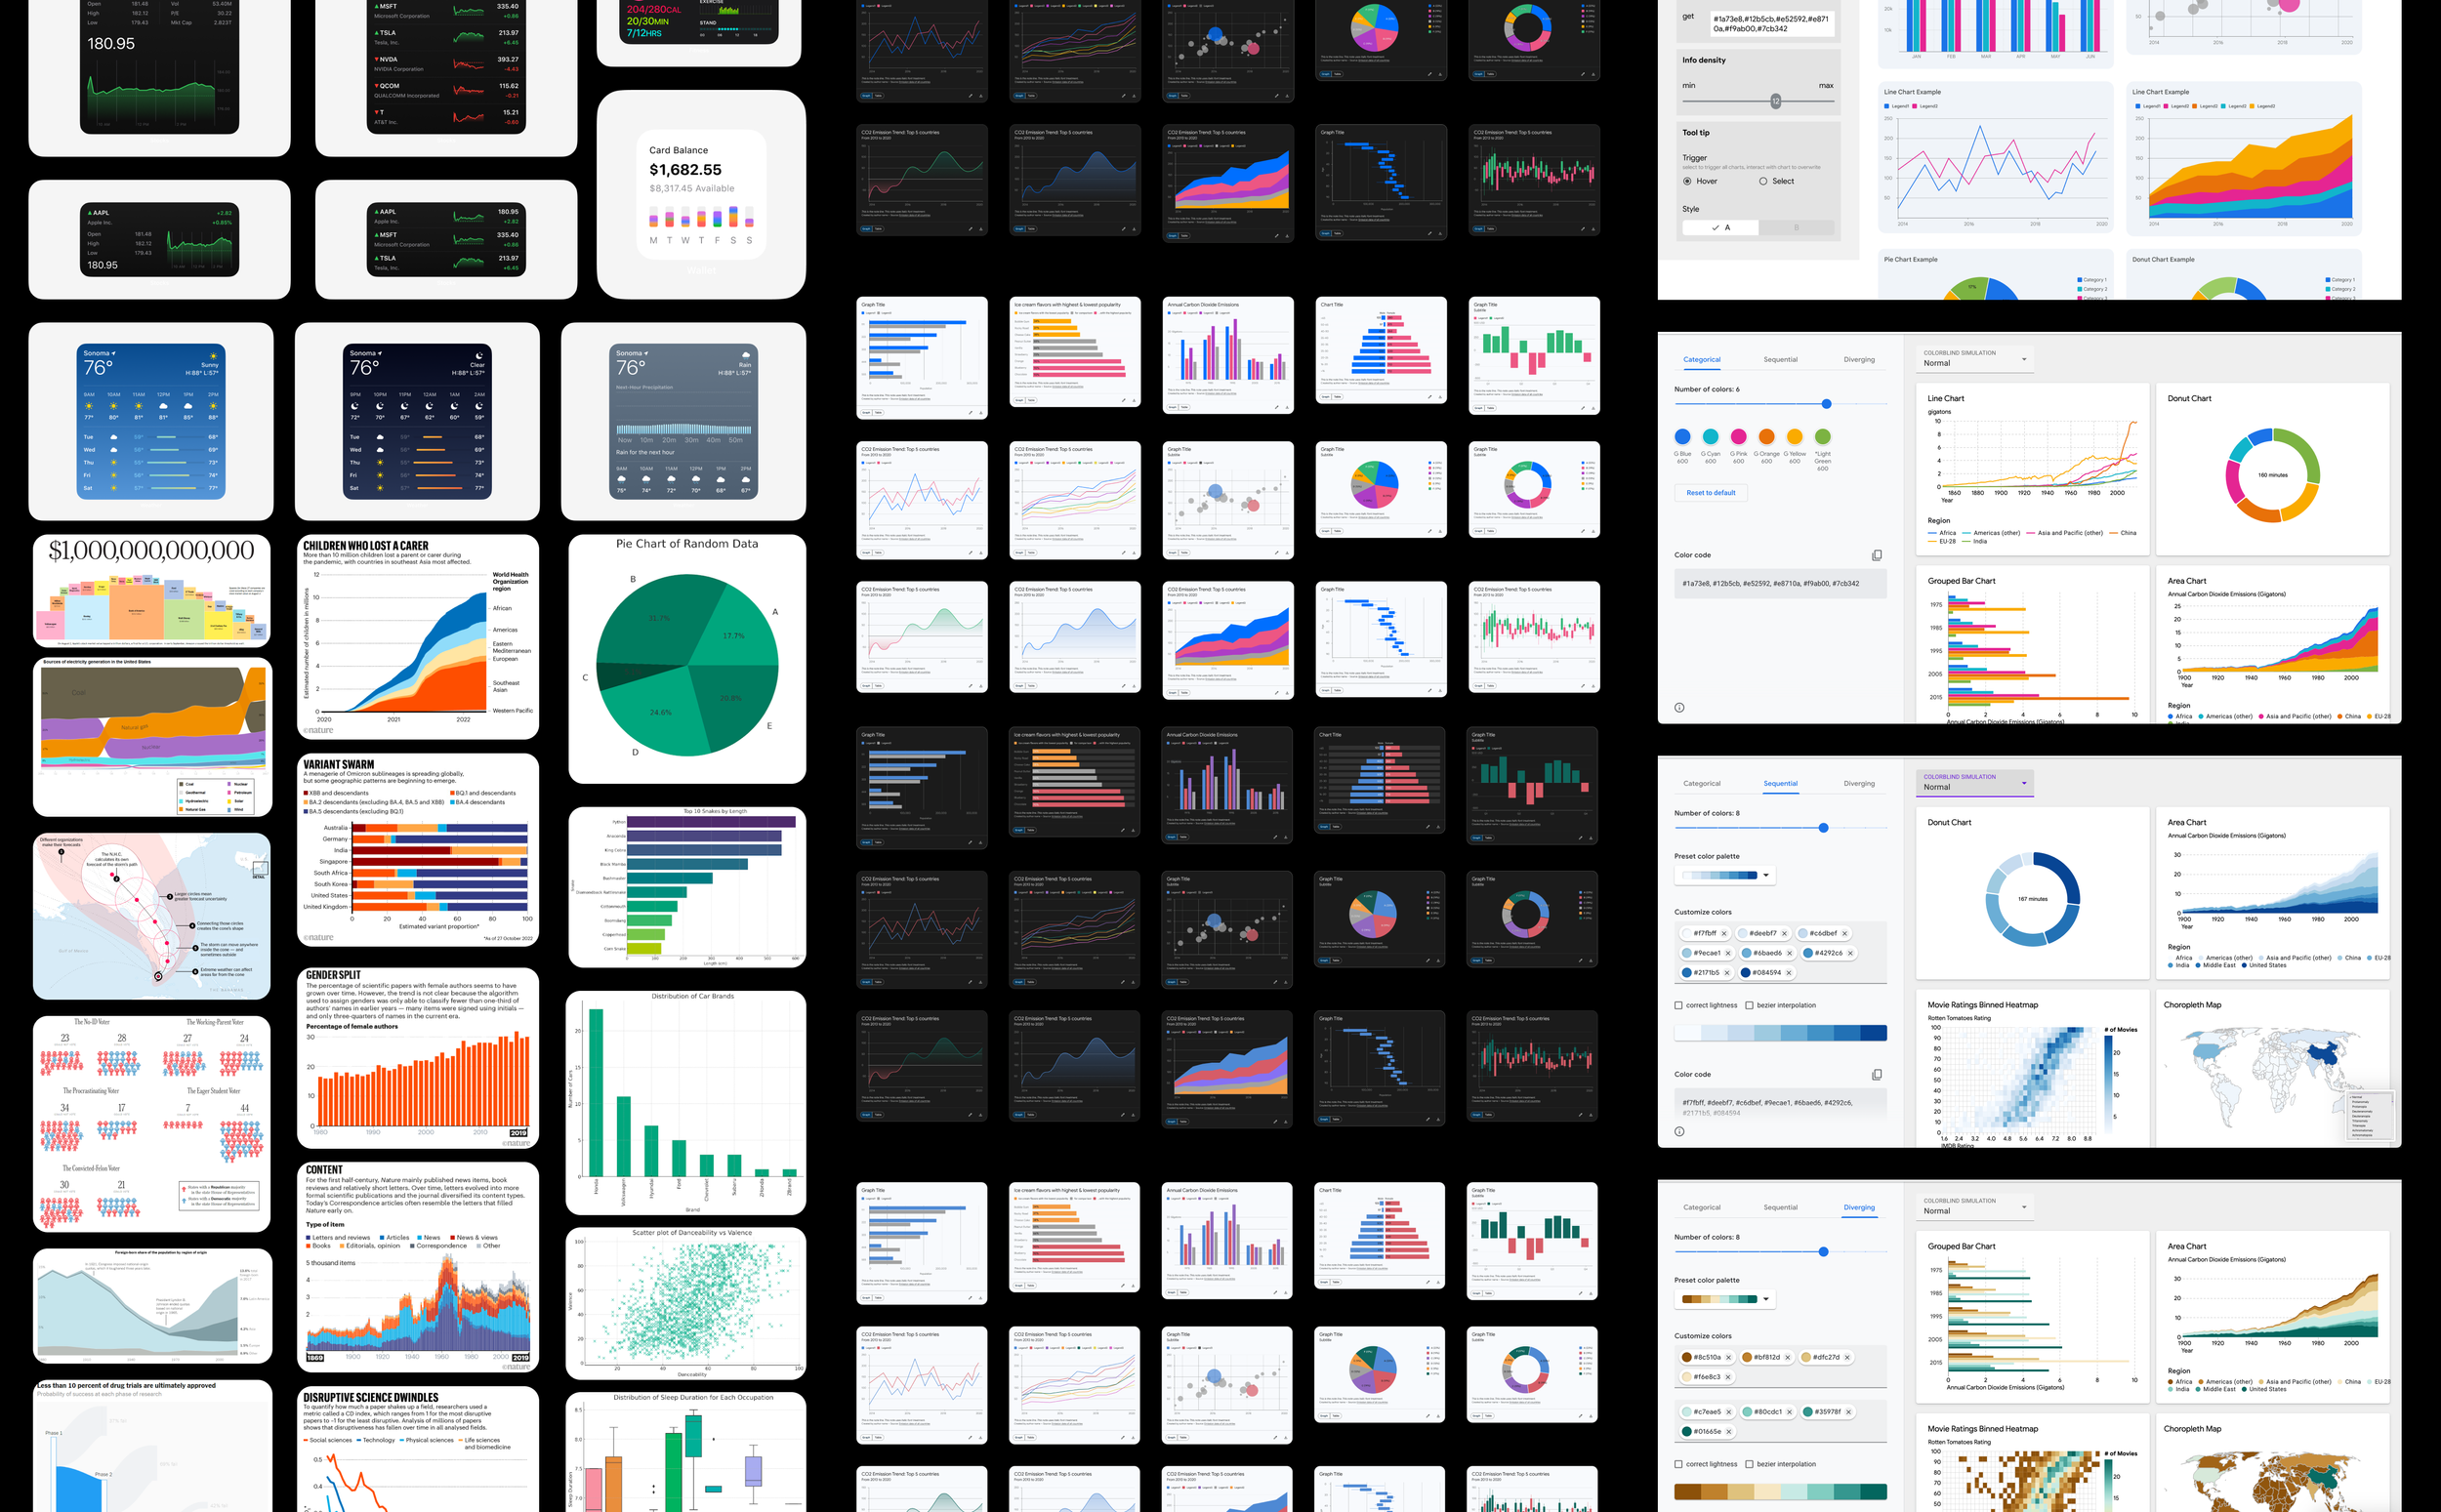
These discoveries highlighted the necessity of creating our own cohesive visual system. I reviewed the NYTimes, Apple Swift cards, ChatGPT, nature publications, and more to grasp color, weight, proportions, and labels and develop a Design System.
Discovery: These discoveries and the adoption of standards took us from audit to exploration to developing tools that met accessibility standards for low vision and color blindness in less than four weeks (which is quite fast). Additionally, we prioritized accessibility from the start and didn't treat it as an afterthought, saving time and money.
06. ABRIDGED CASE STUDY — USER PAIN POINTS
GRAPHS: RESEARCH FINDINGS
Data and user trust
Bard/Gemini is an experiment, so our main issue wasn’t graphs that may depict an untrue story. Our main issue was showing the data source, permitting data to verify that a row wasn’t parsed off, etc.
Manual rework (refinement)
Users' initial experiences with the model often involved frequent rejections, as they requested one graph over another, sought labels for updates, or desired color changes. Refining the model is resource-intensive and typically leads users to feel their workflow was disrupted, viewing the product as "unfinished" or generally of low quality.
Decision paralysis
Having too many options can be overwhelming. We prompted users about the types of graphs, the colors (sometimes over 20), the color families, and more. This often resulted in decision paralysis on the spot, leaving users lacking confidence in their design choices and unsure about the reasons for their selections.
Confidence Gap
Why use a line chart for trends and scatter plots for distributions? A user may not initially understand this, so it’s our responsibility to present options for them to explore and consider their choices rather than overwhelm them with every possibility.
07. ABRIDGED CASE STUDY — SOLUTIONS FOR UXR PAIN POINTS
Data and User Trust
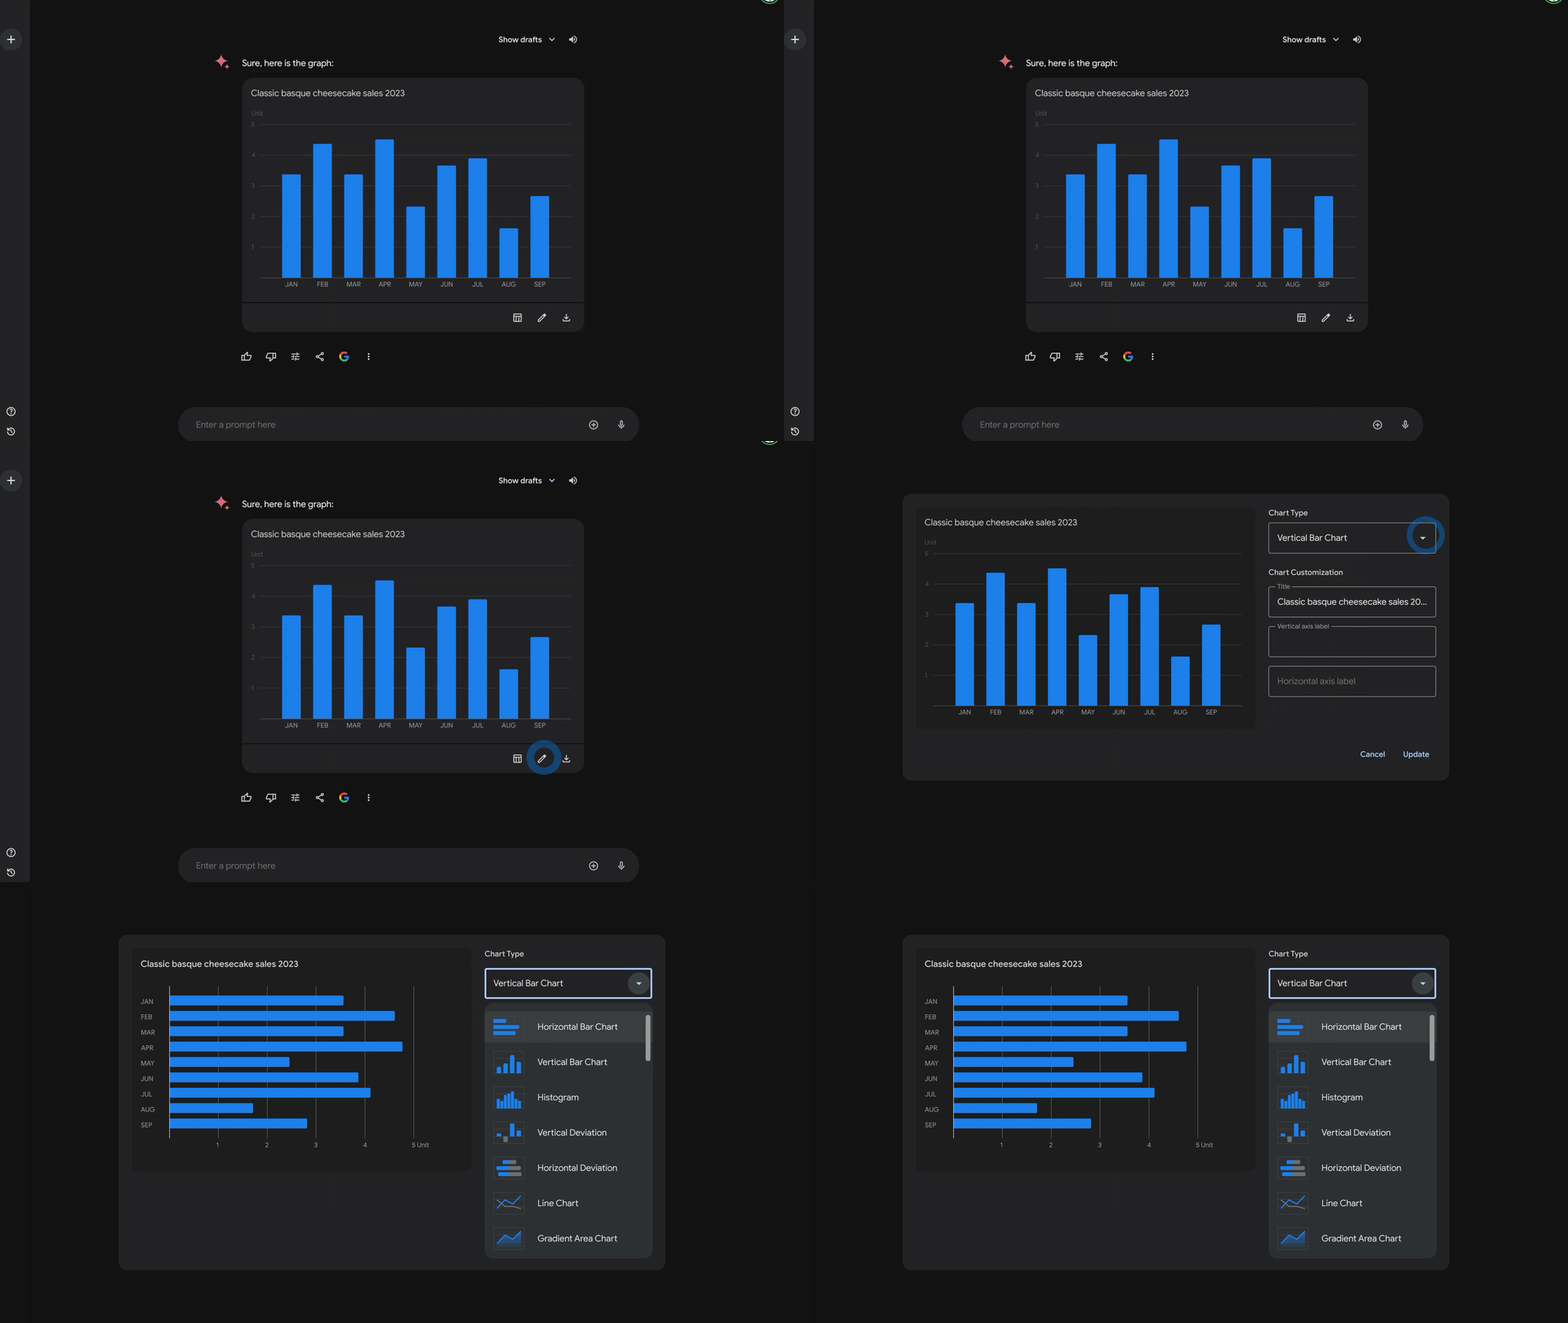
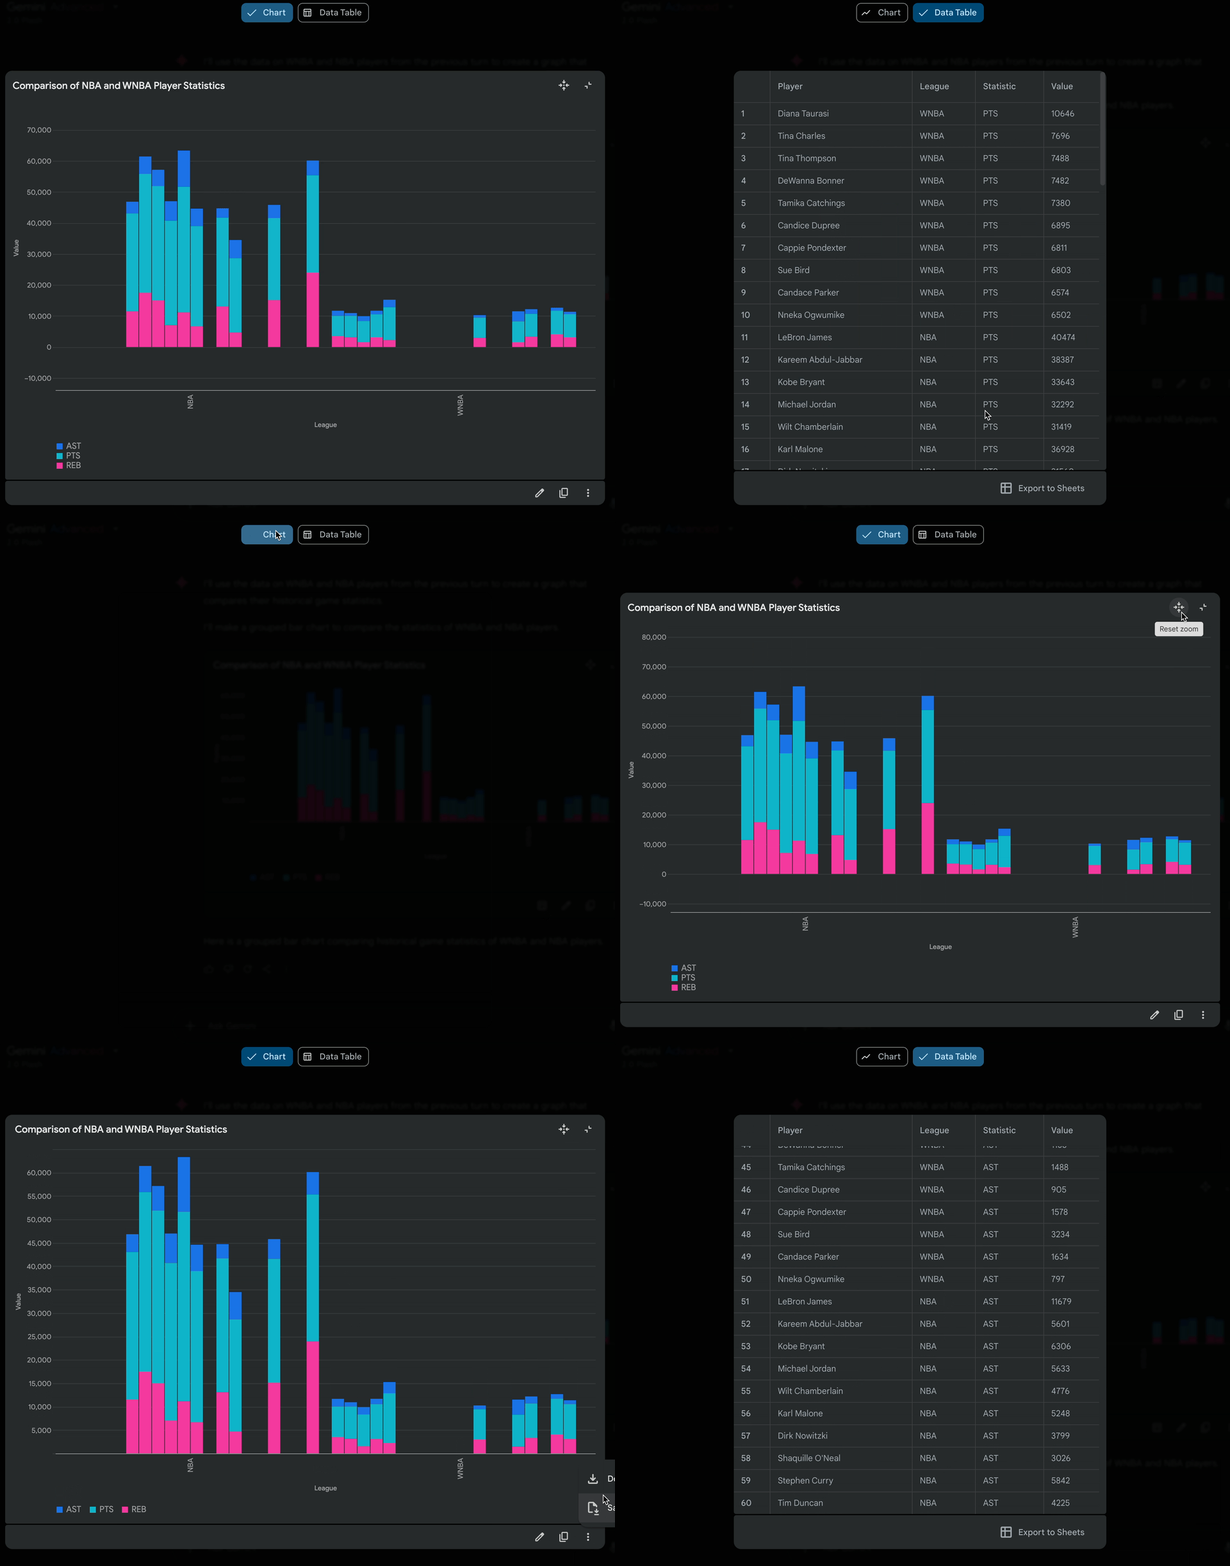
Google has a common pattern in email, chat, and other products we adhered to for the interaction. Yet, the paramount idea here is that we want to ensure a user can easily browse parsed data, swap between the chart and the data set, or download/export if necessary.
This improved user trust and addressed privacy issues (as a user needs access to the data they gave the model).
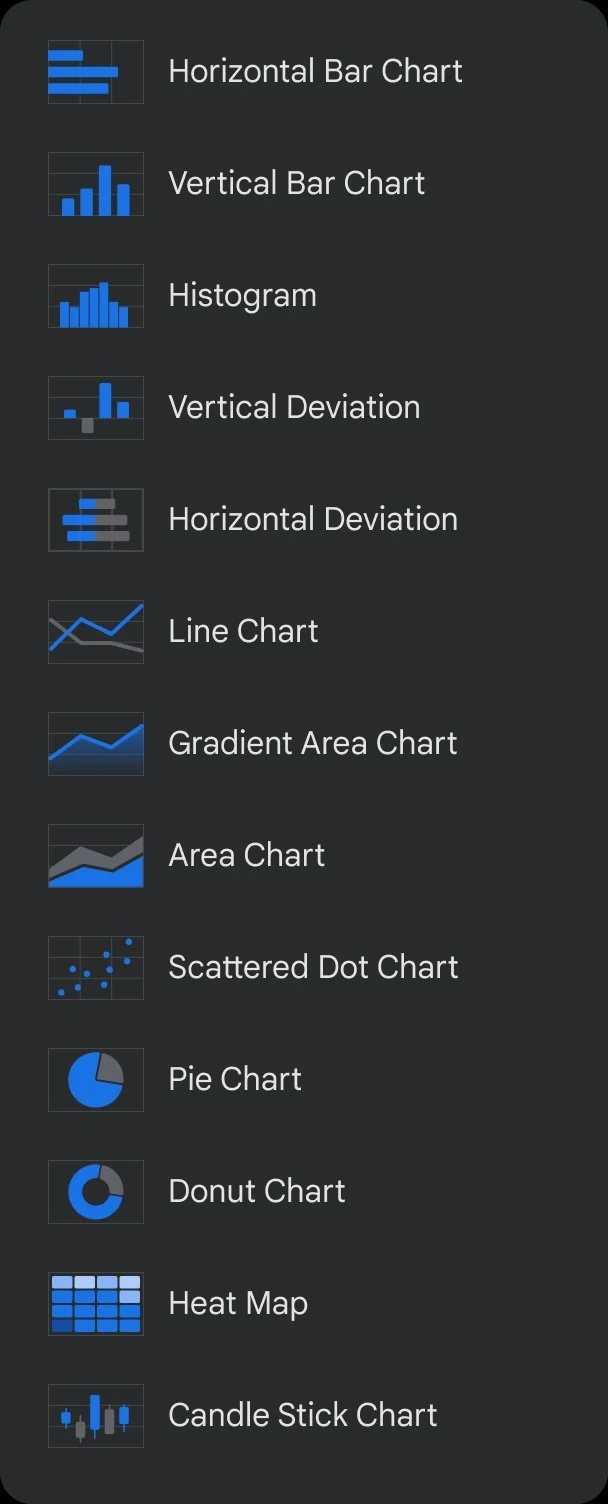
Refinement
We developed a tap/click editing system based on users’ most requested needs to change in a chart/graph. These included chart type, labels, and colors. This would allow users to make the tweaks needed to be sharable without bringing other post-processing to their chart/graph.
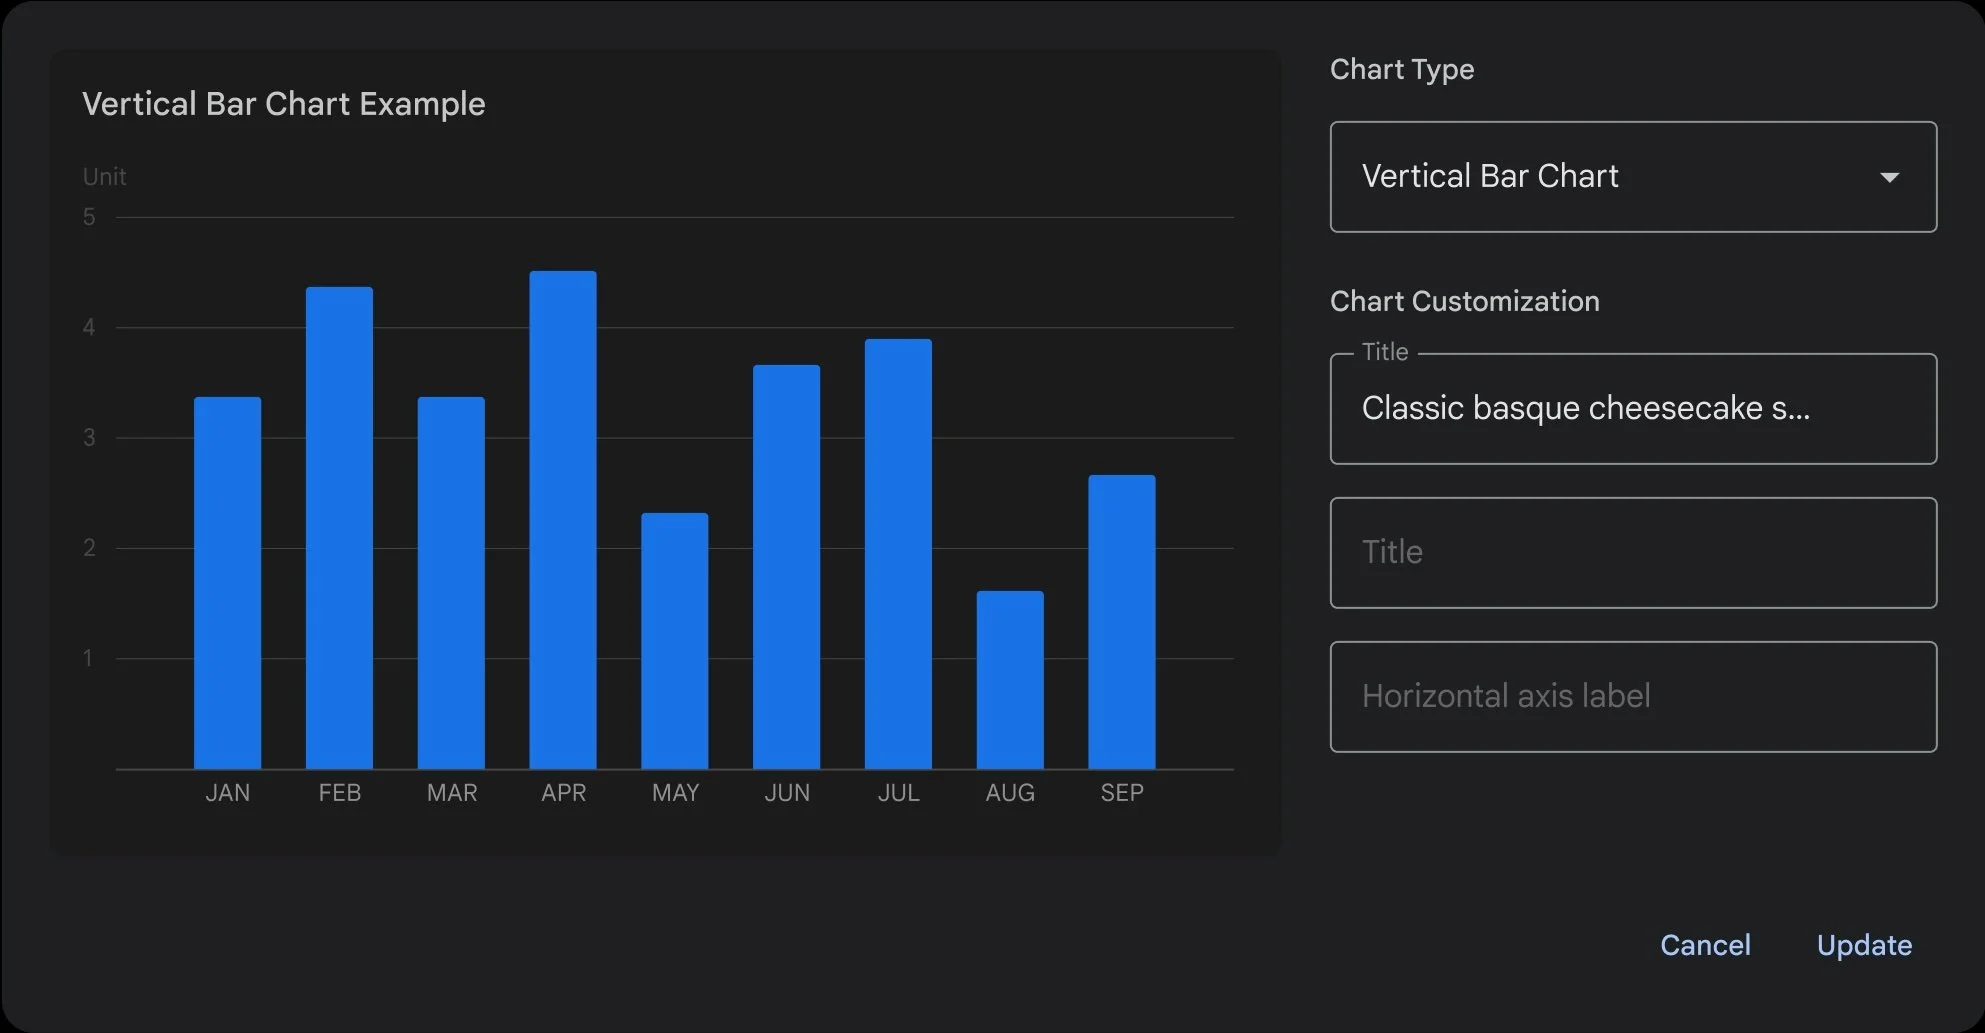
DECISION PARALYSIS
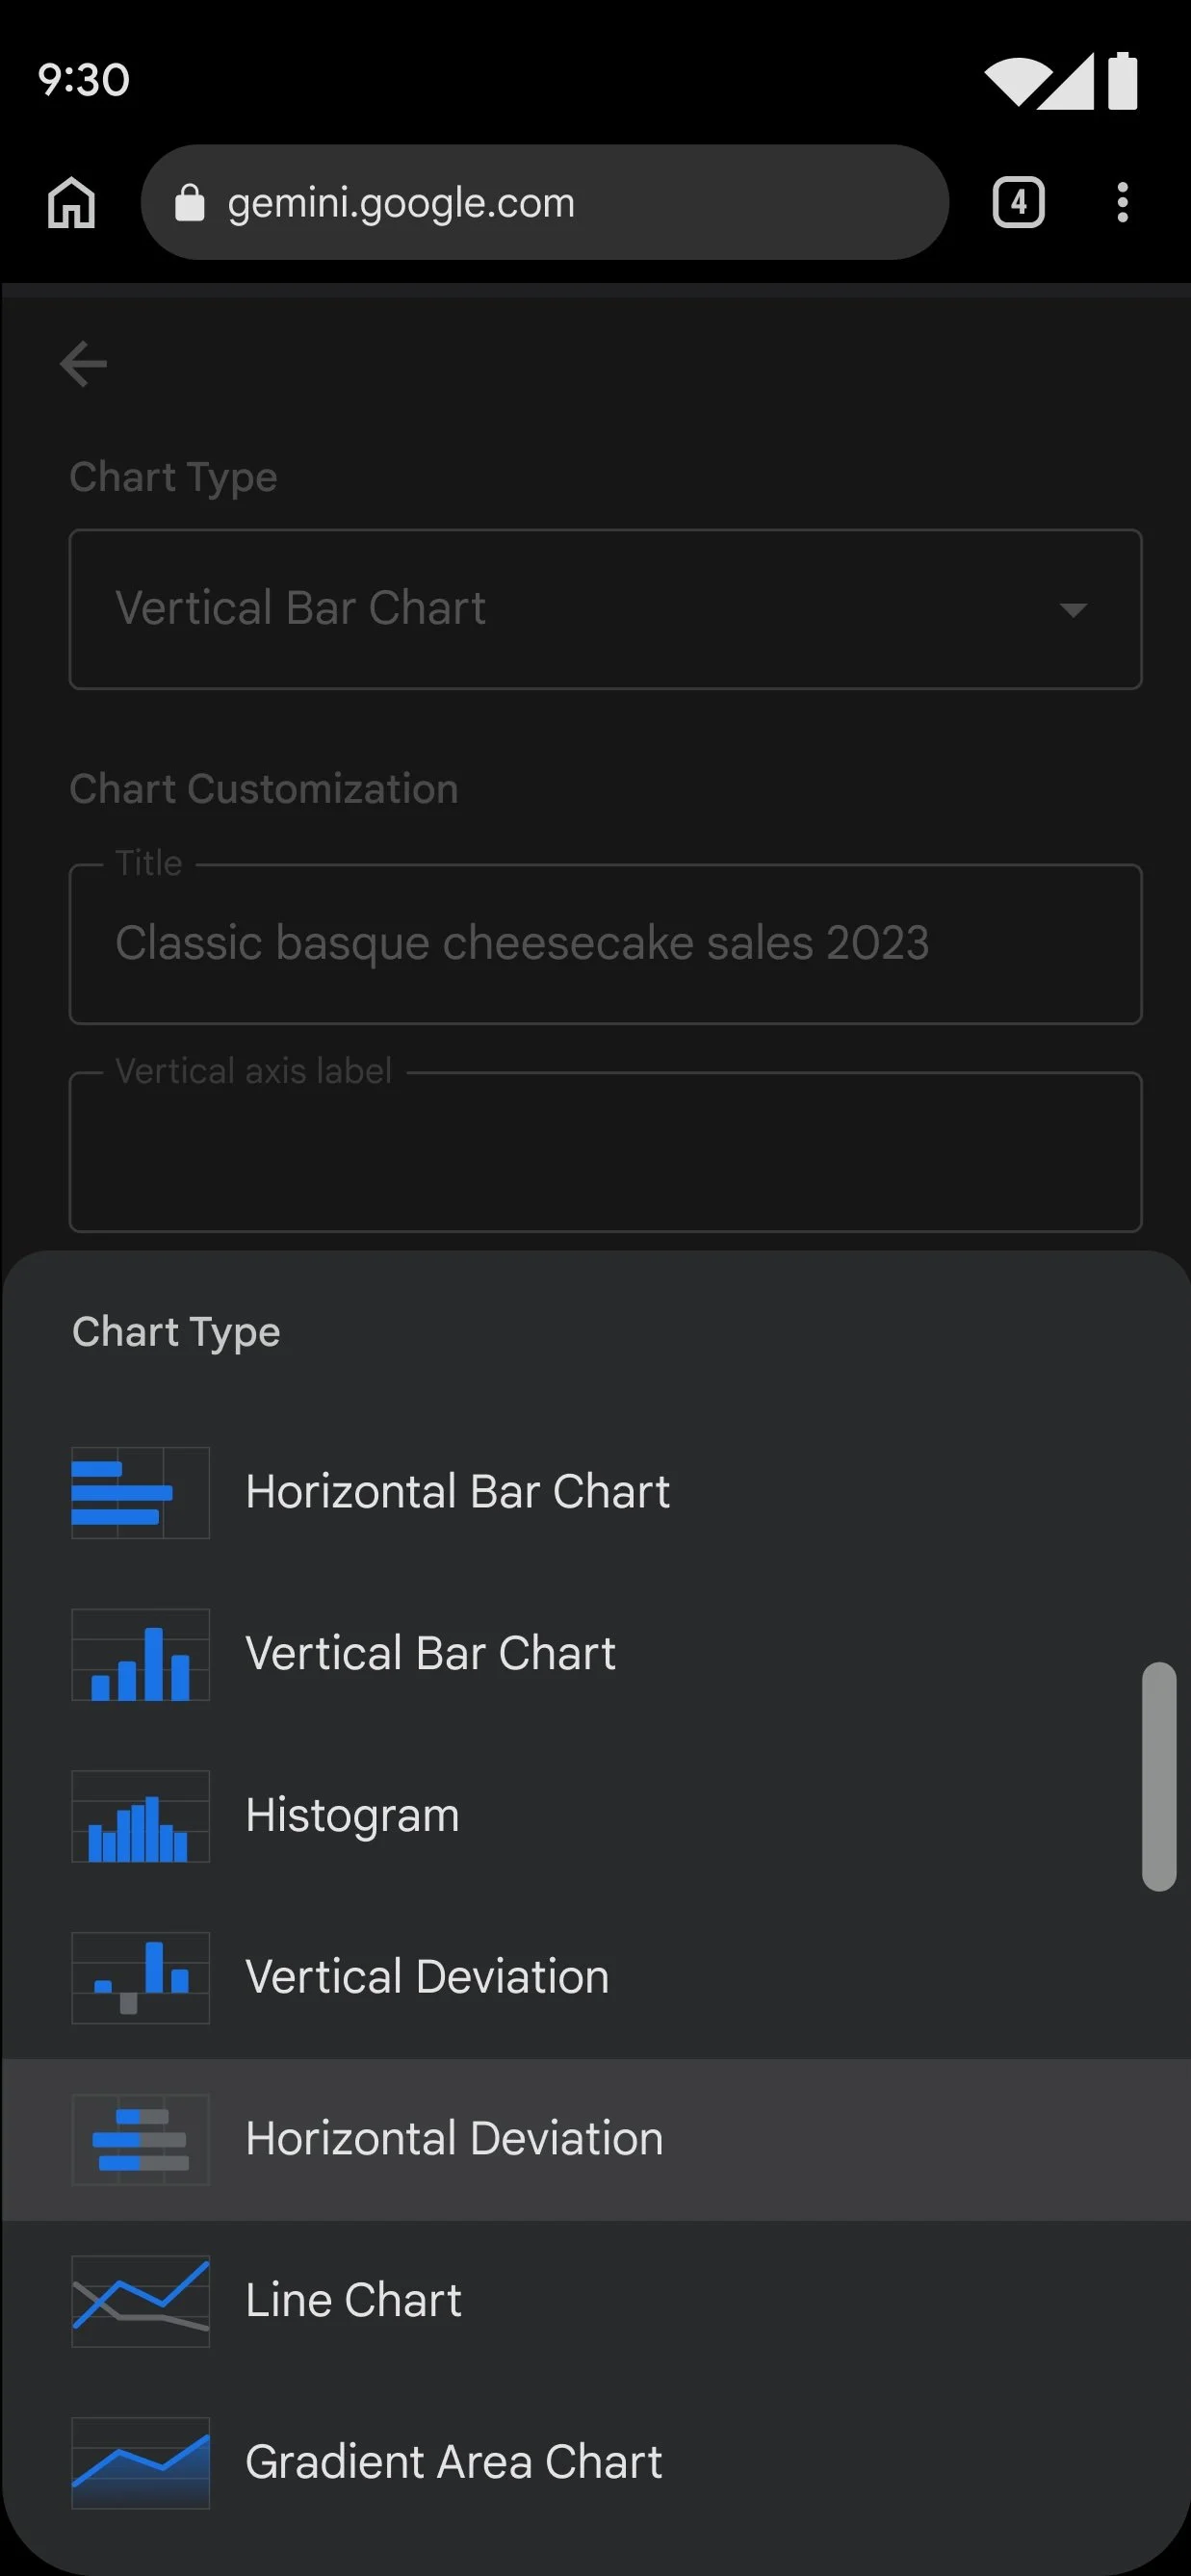
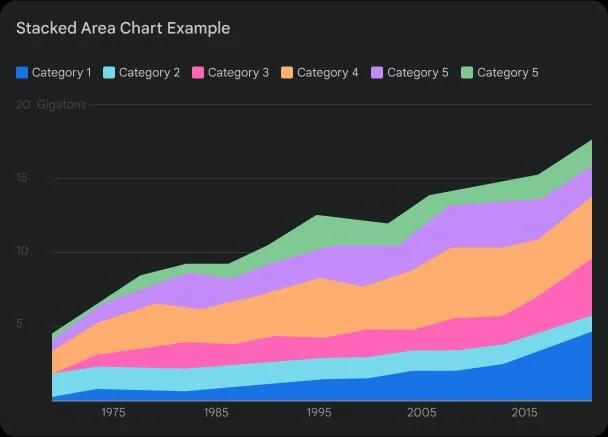
Once a user enters the chart editing flow, we offer a limited set of charts. The model recommends these four charts relative to their data.
Comparisons (bar charts), Trends (line graphs) or proportions (pie or similar)
CONFIDENCE GAP
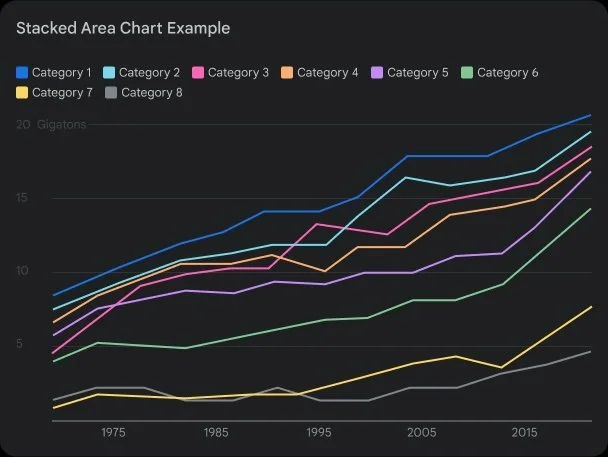
Since we assume users have no prior experience, we expect a one-and-done experience with minimal editing. Generally speaking, though, the expected exploration happens when a user zooms in and out of the data and presses the edit button to see what other graphs look like and feel like.
08. IN CLOSING
GRAPH RESULTS
Users can confidently generate accurate visualizations on first try
Less time spent adjusting and validating data sources
Reduced confusion about available options
Through UX experiments, we reduced the bounce rate and improved data processing using the graph editor solution.
CODE RESULTS
Users can confidently access code samples.
Obtain knowledge guidelines regarding the definition of functions and the reasoning behind the decisions made for the code.
This project of Charts and Graphs isn’t just about generating charts or code; it’s also about understanding through editing data and code. Whether you’re trying to understand why certain graphs are used or what arrays are used for in coding, the experiment remains about utilizing new toolsets with minimal starting pain points.
Furthermore, we are bringing learning into one space using a set of tools as a canvas or idea space. This brings us closer to understanding how information, code, and data can be interpreted and understood in multiple ways. One of our participants put it best: “It’s as if I can talk to my graphing calculator,” said a UXR participant while using graphs.
With the internet as our canvas, what insights can we gain from a knowledgeable assistant with a deep memory and a thorough, albeit somewhat verbose, information partner?